Science

The Data that Speaks

Vaccination is a cheap and effective way of combating many infectious diseases. While it has saved millions of people around the world, vaccine sceptics also emerged, often using unscientific claims or conspiracy theories. This calls for extra efforts from the scientific community in fighting against misinformation. Today, we use a few R-based visualisation techniques to communicate the impact of vaccination programs in the US in the fight against diseases.

We use data compiled by the Tycho project on the US states available with the dslabs package.


library(dslabs)
library(tidyverse)
library(RColorBrewer)

vac_data <- us_contagious_diseases

the_disease = "Polio"
vac_data <- vac_data %>%  filter(disease == the_disease & !state%in%c("Hawaii","Alaska")) %>% 
  mutate(rate = count / population * 10000) %>% 
  mutate(state = reorder(state, rate))


vac_data %>% ggplot(aes(year, state, fill = rate)) + 
  geom_tile(color = "grey50") + 
  scale_x_continuous(expand=c(0,0)) + 
  scale_fill_gradientn(colors = brewer.pal(9, "Reds"), trans = "sqrt") + 
  geom_vline(xintercept = 1955, col ="blue") +
  theme_minimal() + 
  theme(panel.grid = element_blank()) + 
  ggtitle(the_disease) + 
  ylab("") + 
  xlab("")

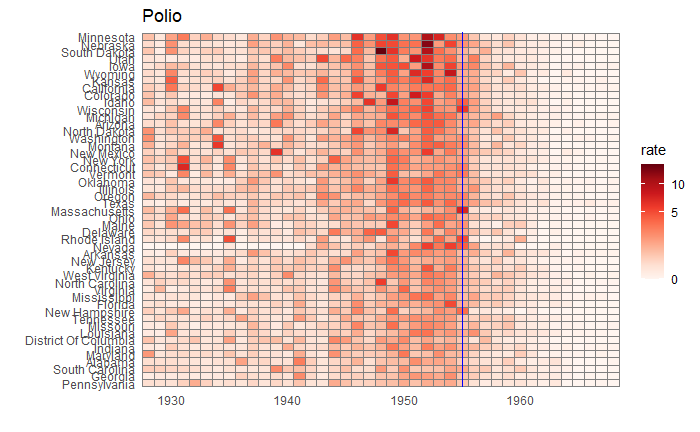
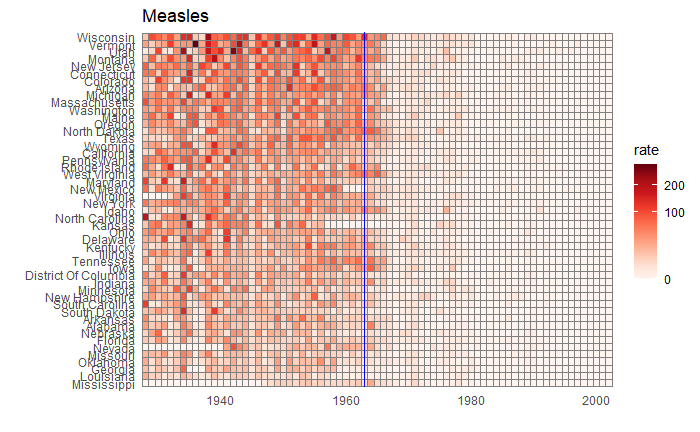
Now, changing the disease to measles and the start of vaccination to 1963, we get the following plot.

The Data that Speaks Read More »

Why Most Published Results are Wrong

It is the title of a famous analysis paper published by Ioannidis in 2005. While the article goes a bit deeper in its commentary, we check the basic understanding behind the claim – through Bayesian thinking.

Positive predictive value, the ability of analysis to predict the positive outcome correctly, is the posterior probability of an event based on prior knowledge and the likelihood. The definition of PPV in the language of Bayes’ theorem is,

P(T|C_T) = \frac{P(C_T|T) P(T) }{P(C_T|T) P(T) + P(C_T|nT) P(nT)}

P(T|CT) – The probability that the hypothesis is true given it is claimed to be true (in a publication)
P(CT|T) – The probability that the claim is true given it is true (true hypothesis proven correct)
P(T) – The prior probability of a true hypothesis
P(CT|nT) – The probability that the claim is true given it is not true (false hypothesis not rejected = 1 – false hypothesis rejected)
P(nT) – The prior probability of an incorrect hypothesis (1 – P(T))

Deluge of data

The last few years have seen an exponential growth of correlations due to a flurry of information and technology breakthroughs. For example, the US government issues data of ca. 45000 economic statistics and an imaginative economist can find out several millions of correlations among those, most of which are just wrong. In other words, the proportion of causal relationships in these millions of correlations is declining with more data. In the language of our equation, the prior (P(T)) drops.

Suppose the researcher can rightly identify a true hypothesis 80% of the time (which is quite impressive) and rightly reject an incorrect one at 90% accuracy. Yet, the overall success, PPV, is only 47% if the prior probability of a true relationship is only 1 in 10.

P(T|C_T) = \frac{0.8 * 0.1}{0.8 * 0.1 + 0.1 * 0.9} = 0.47

References

Why Most Published Research Findings Are False: John P. A. Ioannidis; PLoS Medicine, 2005, 2(8)

The Signal and the Noise: Nate Silver

Why Most Published Results are Wrong Read More »

Timeless Photon

Do you know how long it takes for light from 100 lightyears away from earth to reach us? The answer is: it depends; on where you place the clock. If it is your watch, it will take 100 years. But what if the timepiece was on the photon?

As per the ‘special theory of relativity‘, the faster an object moves, the slower the time ticks for it relative to the observer.

t = t_{photon} \frac{1}{\sqrt(1 - \frac{v^2}{c^2})}

t = time as measured by a stationary observer
tphoton = time as measured by the travelling object
v = speed of the travelling object and
c = speed of light.

Now, substitute v = c; photon (light) travels with the speed of light! tphoton becomes zero.

In other words, light – from wherever it is – reaches you the moment it is born. But you may take one hundred years to catch it!

Timeless Photon Read More »

Muon Paradox

Muons are subatomic particles formed by high energy collisions of cosmic rays with air molecules in the earth’s atmosphere about 15 km from the surface. These particles have an average lifetime of 2.2 microseconds. How do you know about muons? Because you can measure their presence using particle detectors.

Do you see anything weird with the above statements? Well, take out your pen and paper and calculate the distance a muon travels before it’s finished. And use the maximum speed, the speed of light.

speed = 300,000 km/s
time = 2.2 x 10⁻⁶ s
distance = speed x time = 0.66 = 660 m

So, what’s going on here? The muons should be done in the first 660 metres after their journey from 15 km high. But they do come home. Think of it this way: that is only possible if their time of 2.2 microseconds is slower than ours or our distance of 15 km is shortened for them.

Since they are travelling pretty fast, their time passes slowly, like the following:

t = t_\mu \frac{1}{\sqrt(1 - \frac{v^2}{c^2})}

Put v = 99.9% of speed c, the speed of light, and you get 22 microseconds. So, for a muon that travels at 99.9% the speed of light, it will live for 22 microseconds (for us), and during that time, it can travel 6 km!

By the way, we just proved Einstein’s theory of special relativity.

From a muon’s perspective, we are moving closer to them at 99.9% speed of light. And when that happens, the distance contracts by the following formula.

L = L_o \sqrt(1 - \frac{v^2}{c^2})

This Paradox Proves Einstein’s Special Relativity: Up and Atom

Muon Paradox Read More »

Peto’s Paradox

We saw possibilities of random errors during cell divisions leading to mutations. Despite all the corrective mechanisms that the body has, some of those can lead to genetic diseases such as cancer. Naturally, one would expect the probability of cancer to be proportional to the number of cell divisions. If you extrapolate the logic further, it is logical to conclude that the number of cells, the larger the animal, will lead to more occurrences of cancer.

In other words, an elephant has more probability than humans, which, in turn, has a lower chance than a blue whale. But that is never seen in real life. This lack of correlation between animal size with the propensity to get cancer is known as Peto’s Paradox.

Peto’s paradox: Wiki
What is Cancer: NIH

Peto’s Paradox Read More »

Long-Term Evolution Experiments

The Long-term Experimental Evolution Project of Prof. Richard Lenski’s team at Michigan state university is a significant movement in our understanding of evolution. The team so far has achieved three decades of evolution of E.Coli bacteria in their laboratory. That corresponds to more than 76,000 generations of the organism starting from the common ancestor, noting that it goes through six or seven generations per day!

The experiments started with growing bacteria colonies in a petri dish and taking small sub-samples to 12 flasks containing a solution of glucose, potassium phosphate, and citrate at 37 oC. On the next day, 1% of the sample from the flask is transferred to a fresh sterile flask. And the process has been repeated every day for the last 34 years.

For humans, 76,000 generations could mean more than 1.5 million years. But does it mean the experiments are expected to see what changes animals or humans to accumulate in 1.5 million? Well, this is a question that ant-evolutionists ask. We will answer these questions in the coming days.

References

Long-Term Evolution Experiments: LTEE

LTEE: Wiki

Long-Term Evolution Experiments Read More »

T. gondii Continues

The previous post that a parasite triggers wolves to become courageous leaders may sound fantastic, but something difficult to accept as a fact. If you recall rule number one of statistics: “correlations are not causations”, you may realise that there could be other explanations to understand wolves’ the peculiar behaviour of some wolves who happened to have been infected.

What if the same behaviour, aggression, tendencies to walk out of the pack, and courage is the reason that caused the disease in the first place? The claim is not entirely without reason, as the animal gets the illness from cougars that share the same land space. After all, these are observational studies. Naturally, we would have liked to see results from a controlled study.

The researchers selected 64 laboratory rats and infected 32 of them (experimental group) with a cyst-forming strain of the parasite. The other 32 are given a placebo (control group). The rates were exposed to an area, and its corners contained distinct odours, representing four species – rat, cat, rabbit and neutral.

Now, a bit of evolution. Small mammals under heavy predation pressure evolved as species that could identify and avoid the presence of their predators. For rats, it is the ability to smell and avoid cats. You know already that it is not a rat that decided to build the capability to help itself; rather, as per the principle of survival of the fittest, only those rat species survived and had multitudes of offspring. Studies have shown that rats don’t lose the anti-predator behaviour (aversion to cat smell) even after hundreds of generations without having felt the presence of a cat.

And this is where our study got interesting. In the experiment, the status of the rats, infected or otherwise, did not change their movement towards the three non-cat selling areas. Whereas the uninfected rate disproportionally avoided cat-smelling spots compared to the infected.

References

T. gondii Continues Read More »

When a parasite can make you macho

What controls a person’s behaviour? Humans always seem to have some answers to this question. Historically, and still is the case for a large portion of humanity, it has been attributed to some types of divine power. At some stage, people, especially poets, thought it was the heart that controls humans; listen to your heart, they said! As science has progressed, the importance of the brain to our existence came in, and now the scientific community knows how the brain, and chemicals called hormones, can make a person. There is a new entrant to this list – parasites!

Parasite cheerleaders

The impact of Toxoplasma gondii, a protozoan parasite, on species has been the subject of several studies over the years. Past experimental studies have shown that infections can raise dopamine and testosterone production. All it requires for a parasite is to make a cyst at the right place, i.e. the brain. And can cause increased aggression and risk-taking behaviour, failure to avoid olfactory predator cues (i.e., seeking out instead of avoiding felid urine), and decreased neophobia (fear of novel food).

T. gondii in wolf’s clothing

A recent article by Meyer et al. in Communications Biology is another example, this time about the behaviour of wolves infected with the parasite. And they had 26 years of serological and observational data.

The researchers looked for three parameters of risk-taking: 1) leaving the pack, 2) getting dominant social status, and 3) approaching people and vehicles, and two causes of death: 1) death from other wolves and 2) death from humans.

The study has shown that the parasite has influenced the behaviour of wolves. The researchers identified an increase in the odds of dispersal and becoming a pack leader in wolves seropositive for T gondii.

References

Meyer et al., 5 (1180), 2022: Communications Biology
Parasite gives wolves what it takes to be pack leaders: Nature
Fatal attraction in rats infected with Toxoplasma gondii: Proc Biol Sci.

When a parasite can make you macho Read More »

En-ROADS to Afforestation

Let’s run another popular choice for CO2 removal – aforestation or planting trees. In this scenario,100% of the available land is used for afforestation.

Now, compare that with a highly reduced rate of deforestation.

The outcome is the same – a very marginal reduction of temperature rise.

It takes time for trees to grow

The key reason for the aforestation failure is the time it takes for the trees to grow. The time till 2100 is less than 80 years, and an 80-year-old tree is still young!

References

The Paris Agreement: UNFCCC

EN-ROADS: Climate Interactive

En-ROADS to Afforestation Read More »

En-ROADS to Carbon Price

We will use En-ROADS to simulate the impact of the carbon price on climate goals. First, we switch off the efficiency buttons from the previous runs. And set the carbon price to 100 $/tone CO2.

It would be interesting to see how the price impacted the energy mix.

As you can see, the market turned away from Coal in favour of more renewables. We now raise the price to 200 $/tone CO2.

References

The Paris Agreement: UNFCCC

EN-ROADS: Climate Interactive

En-ROADS to Carbon Price Read More »