July 2022

Path of a Random Walker

Let’s demystify the concept of probability games and the law of large numbers with coin-tossing as an example.

Law of large numbers

We know what it means: when one estimates the mean of several thousand outcomes of an experiment, the result converges to the expected value or the theoretical average. For example, if one tosses a coin a million times, the mean head becomes 0.5 or 50%. Recall the plot we developed earlier.

But that is deceptive. It gives a feeling that if you play a million games, with 1$ for a head and -1$ for a tail, your wallet remains unchanged, whereas if the game is short, you gain or lose more money. That is not true.

Higher absolute, lower average

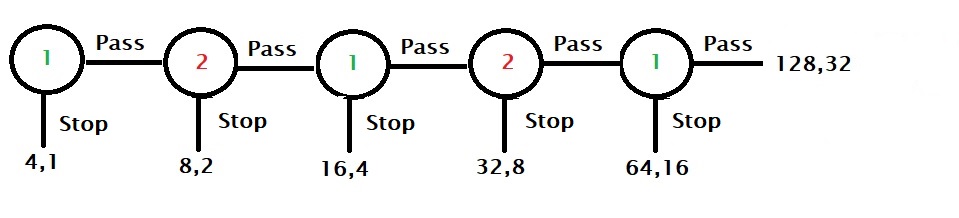
In the coin tossing game, how do you calculate the average head? It is the number of occurrences of heads divided by the number of games played. If I play only one game and get a head, it is 1, and tail, it is 0, the two extreme average values you can ever get (1/1 and 0/1). If it was a game described in the earlier section, you may gain a dollar or lose one. On the other hand, if you play 100 games and win 60, you get 20 dollars (60-40), and the mean head is 60/100 = 0.6. If you play a million games and win 184 more heads than tails, the mean is even smaller and close to the theoretical (500092/1,000,000 = 0.50009). But you gain more money ($ 184) and can also lose more money.

Random walk

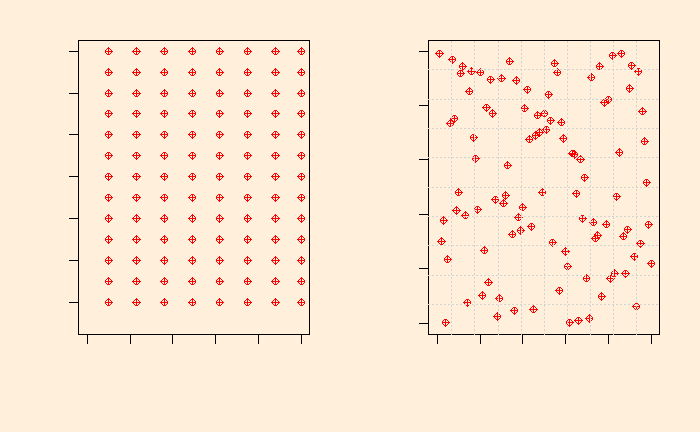
The figure we saw in the earlier section showed the average and not the absolute gain. To display the successes and flops of the games played, you resort to a random walk model. Imagine you are standing at the intersection of the X and Y axes, i.e. at zero. You play, and if you win, you move one unit to the right, and if you lose, you move one to the left.

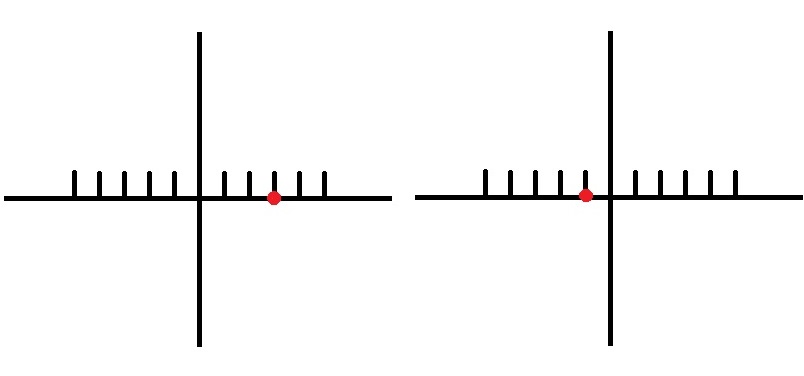
Here are two such walks. On the left, the walker had the following outcomes: H, H, T, H, H. This is equivalent to 1, 1, -1, 1, 1 in terms of money and 1, 2, 1, 2, 3 in terms of position from the origin. The corresponding moves of the right walker are (outcome H, H, T, T, T), (money 1, 1, -1, -1, -1) and (position 1, 2, 1, 0 -1).The last digit of the position vector is the current position after five games.

To sum up

To sum up: the law of large numbers doesn’t mean if you play a large number of coin-tossing games, you win or lose nothing. It only means that the effort you put in (gain per game or the money per time) diminishes with games. The walker moves further and further from the origin, although the rate of change becomes slower. We will see more on the random walks in the next post.

Path of a Random Walker Read More »

Probabilistic Insurance

Probabilistic insurance is a concept introduced by Kahneman and Tversky in their 1979 paper on prospect theory. Here is how it works.

You want to insure a property against damage. After inspecting the premium, you find it difficult to decide to pay for the insurance or leave the property uninsured. Now, you get an offer for a different product that has the following feature:

You spend half the premium but buy probabilistic insurance. In this case, you have a probability p, e.g. 50%, in which you, in case of damage, will pay the rest of the 50% and get fully covered, or the premium is reimbursed, and the damage goes uncovered.

For example, the scheme works in the first mode (pay the reminder and full coverage) on odd days of the month and the second mode (reimbursement and no coverage) on even days!

Intuitively unattractive

When Kahneman and Tversky asked this question to the students of Standford university, an overwhelming majority (80%) was against the insurance. People found it too tricky to leave insurance to luck or chances. But in reality, most insurances are probabilistic, whether you are aware or not. The insurer always leaves certain types of damages outside their scope. The investigators proved using the expected utility theory that probabilistic insurance is more valuable than a regular one.

Tversky, A.; Kahneman, D., Econometrica, 1979, 47(2), 263

Probabilistic Insurance Read More »

The Shape of Randomness

If I give a task to mark 100 random dots on a paper, which of the following two patterns do you likely to come up with?

Studies have found that there is a tendency for people to identify uniform patterns when asked about randomness. In the above picture, the one on the right was generated by a random program.

Now another: Two students were asked to toss coins 20 times and record. Following is what they came up with. If one of them made up his experiment, who could that be?

1) THTTHTTHHTTTTTHTTHTH
2) THHTTHTHTTHHTHTTHTH

Clusters in randomness

It is difficult for most people to imagine that long clusters of Ts in the first case come randomly. After all, shouldn’t the equal probabilities of occurrence of heads and tails suggest an even distribution, like in the second case?

The Shape of Randomness Read More »

Return of the Dice

What is the probability of rolling a dice six times and getting different faces?

dice, roll the dice, to play-2031512.jpg

Remember the conjunction rule (generalised AND rule) that connected the joint probability with the conditional probability?

P(A \displaystyle \cap B)=  P(A) * P(B | A)

Back to dice

Let P(A1) be the probability of getting the first face = 1
P(A2|A1) be the probability of getting a different face from die 1 = (5/6)
P(A3|A1A2) be the probability of getting a different face from die 1 and die 2 = (4/6) etc.

We must find the joint probability of A1, A2, A3, A4, A5, and A6.

\\ P(A1 \displaystyle \cap A2 \displaystyle \cap A3 \displaystyle \cap A4 \displaystyle \cap A5 \displaystyle \cap A6)= P(A1) * P(A2 | A1) * P(A3 | A1A2) * P(A4 | A1A2A3) * P(A5 | A1A2A3A4)*P(A6 | A1A2A3A4A5) \\ \\ P(\text{all different)}  = 1*\frac{5}{6}*\frac{4}{6}*\frac{3}{6}*\frac{2}{6}*\frac{1}{6} = \frac{5}{324} = 1.5 \%

Frequentist way

For the first roll, there are six choices. Once the first slot is taken, there are five choices for the second roll. Therefore, 6 x 5 for the first and second choices together. If you extend the logic for all the six rolls, you get 6 x 5 x 4 x 3 x 2 x 1 or 6!

Possibilities for the required event = 6! = 720
Total possibilities of rolling six dice = 66 = 46656
P(for the required event) = 720/46656 = 1.5%

Return of the Dice Read More »

Randomness and Doctrine of Signature

Take a carrot, cut a slice, and look closely. Does it resemble your eyes? See what I meant; it provides the nutrient that is good for the eyes. Have you ever wondered why the tomatoes cut through the middle appear like your heart? Do you know that the polyunsaturated fats of walnut boost your brain? Don’t you know kidney beans are the best thing for your kidney?

The seed for the brain

Start with Mr Walnut. Here is what it looks like:

walnut, nut, shell-3072652.jpg

So naturally, it should be related to the brain. Isn’t it? Well, let me search: yes, it has polyunsaturated fats that are good for the brain! Well, that can also be good for the heart. But that is not the point. And it does not resemble my heart. What about sunflower seeds, flax seeds or flax oil, and fish, such as salmon, mackerel, herring, albacore tuna, trout, corn oil, soybean oil, and safflower oil. They all can give you similar nutrients. But they don’t look like a brain. So, let walnut be the brand ambassador of my brain. Why not? By the way, Cahoon et al. searched the literature but could not find any strong association between walnut and cognitive power. Maybe, they did not search deep enough!

Carrot for your eyes

Cut a carrot and see if it appears like your eyes.

carrot, leek, healthy-1256008.jpg

No? If not, cut it until you see some part that resembles your eyes. Come on; you can do it. But what about these: tomatoes, red bell pepper, cantaloupe, mango, beef liver, and fish oils. They, too, contain vitamin A. So what?

Vitamin A is not going to give you night vision. But it should be part of your diet as it helps manage your health, including eye health. Also, carrot doesn’t come packed with vitamin A. But it contains its precursor beta carotene.

Kidney beans

beans, legumes, food-1001032.jpg

What is the difference between kidney beans and other lentils? Or between blueberries, seabass, egg white, garlic, olive oil, bell peppers, and onions? Well, the key difference is that except for kidney beans, none of the others resembles my kidneys. So, even if they are better food for kidneys than these beans, I am not interested in them.

What about eating jelly beans? Something to research on.

Where do these come from?

Human beings are masters of finding patterns around them and making up stories to support their imagination. The doctrine of signature, too, belongs to that category. It is also a favourite for the creationist folks. Why else is that food created with the shape of your organ? There must be a purpose.

Walnut intake, cognitive outcomes and risk factors: a systematic review and meta-analysis: Pubmed

Cooking Legumes: A Way for Their Inclusion in the Renal Patient Diet: Pubmed

Randomness and Doctrine of Signature Read More »

Of Deals and No Deals

We have seen an explanation of the Monty Hall problem of “Let’s make a deal”, using a 100 door-approach. Let’s imagine a 26-door version. You select one, and the host opens 24 doors that do not have the car. Will you switch your choice to the last door standing? The answer is an overwhelming yes.

Now, switch to another game, namely the deal or no deal. The show contains 26 briefcases containing cash values from 0.01 to 1,000,000 dollars. The player selects one box and keeps it aside. Cases are randomly selected and opened to show the cash inside. Periodically, the dealer offers some money to the player to take and quit the game. If the player refuses all offers and reaches the end, she will have to take whatever is in the originally-chosen case.

Monty’s deal or no deal!

Imagine there are just two boxes left – the one you have selected and the one remaining. The remaining cash values are one and one million. Enter Mr Monty Hall and offers a switch. Will you do it? After all, the original recommendation for the case described in the first paragraph was to switch! But here, there is no need to swap, as you have a 50:50 chance of winning a million from your box. Why is that?

Bayes to the rescue

Before I explain the difference, let’s work out the two probabilities using Bayes’ theorem.
First, the original one (Let’s make a deal): Let A be the situation wherein your chosen door has the car behind and B the one where 24 gates did not have it.

P(A|B) = \frac{P(B|A)*P(A)}{P(B|A)*P(A) + P(B|A')*P(A')}

Substitute the values, P(A) = (1/26), P(A’) = 25/26 and P(B|A) = 1 (the chance of 24 doors have no car given the car is behind your chosen door. Now think carefully, what is P(B|A’), the probability of having no cars behind those 24 doors, given yours does not have a car? The answer is: it remains one because it was the host who opened the door with full knowledge; it was not a random choice!

P(A|B) = \frac{1*(1/26)}{1*(1/26)+ 1*(25/26)} = \frac{1}{26}

So, switching increases your chances to 1 – (1/26) = 25/26.

Second, the new one (Deal or no deal version)

P(A|B) = \frac{P(B|A)*P(A)}{P(B|A)*P(A) + P(B|A')*P(A')}

As before, P(A) = (1/26), P(A’) = 25/26 and P(B|A) = 1. Here is the twist, P(B|A’) is not 1 because the situation of 24 cases did not produce a million came at random and was not due to your host. The probability of that happening, given your case doesn’t contain the prize, is 1 in 25. So P(B|A’) = (1/25).

P(A|B) = \frac{1*(1/26)}{1*(1/26)+ (1/25)*(25/26)} = \frac{1/26}{(2/26)} = \frac{1}{2}

Amazing, isn’t it?

Reference

The Monty Hall Problem: The Remarkable Story of Math’s Most Contentious Brain Teaser: Jason Rosenhouse

Of Deals and No Deals Read More »

Bertrand’s box paradox

It’s time to do one Bayes’ theorem exercise. The problem is known as the Bertrand box paradox and may remind us of the boy or girl paradox.

Imagine there are three boxes. One contains two gold coins, the second two silver, and the third has one gold and one silver. Now you randomly pick a box and take out one coin. If that turned out to be silver, what is the probability that the other coin in that box is also silver?

Intuition suggests that the other coin could either be silver or gold. And therefore, it would be tempting to answer 50%. But that is not true. Let’s apply Bayes’s theorem straightaway. The required probability is mathematically equivalent to the chance of getting two silver (SS), given that one coin is already silver (S) or P(SS|S).

P(SS|S) = \frac{P(S|SS)*P(SS)}{P(S|SS)*P(SS) + P(S|GS)*P(GS) + P(S|GG)*P(GG)}

G represents gold and S, silver.

\\ P(SS|S) = \frac{1*(1/3)}{1 * (1/3) + (1/2)*(1/3) + 0 * (1/3)} = \frac{1/3}{1/2} = \frac{2}{3}

Bertrand’s box paradox Read More »

The Trolley Problem and the Fallacy of Dilemma

First, the two definitions:

The trolley problem

The trolley problem is a thought experiment in ethics about a scenario in which an onlooker has a chance to save five people being hit by a runaway trolley by diverting it to another track, hitting one person.

mine, trolley, lorry-145631.jpg

The fallacy of dilemma

It is an informal fallacy in which the proponent restricts the options to choose into a few, say, two. It is a fallacy because the framing of the premise is erroneous.

Back to the trolley

In my view, the trolley problem is a false dichotomy (two options) problem that does two things. It forces you to believe that there are only two options – kill five or kill one. It then helps you to justify killing the one as one generous act to save five. And this has been consistently practised by political leaders, especially of the oppressor types, to push their malicious agenda whilst satisfying the collective imagination of the majority.

Dealing with the trolley

The best way to deal is to resist the premise. Why are there diversions or two tracks? Why are there only two tracks? Why is the onlooker not closer to the five so she can save them (by pushing or something)? Why does only the diversion switch work and not the stopping switch?

Reading

False dilemma: Wiki
False Dilemma Fallacy Examples: Your Dictionary
Trolley problem: Wiki
Trolley Problem: Merriam-Webster
Should We Trust Nature More than Ourselves?: Slavoj Žižek & Yuval Noah Harari

The Trolley Problem and the Fallacy of Dilemma Read More »

The Centipede Game

Here is a game played between two players, player 1 and player 2. There are two piles of cash, 4 and 1, on the table. Player 1 starts the game and has a chance to stop the game by taking four or the pass to the next player. In the next round, before player 2 starts, each stack of money is doubled, i.e. they become 8 and 2. Player 2 now has the chance to take a pile and stop or pass it back to player 1. The game continues for a maximum of six rounds.

Best strategy

To find the best strategy, we need to start from the end and move backwards. As you can see, the last chance is with player 2, and she has the option to end the game by taking 128 or else the other player will get 256, leaving 64 for her to take.

Since player 1 knows that player 2 will stop the game in the sixth round, he would like to end in round five, taking 64 and avoiding the 32 if the game moved to another.

Player 2, who understands that there is an incentive to be the player who stops the game, can decide to stop earlier at fourth, and so on. So by applying backward induction, the rational player comes to the Nash equilibrium and controls the game in the first round, pocketing 4!

Irrationals earn more

On the other hand, player 1 passes the first round, signalling cooperation to the other player. Player 2 may interpret the call and let the game to the second round, trusting to bag the ultimate prize of 265. Here onwards, even if one of them decides to end the game, which is a bit of a letdown to the other, both players are better off than the original Nash equilibrium of 4.

The Centipede Game Read More »

Benford’s Law

Benford’s law forms from the observation that in real-life datasets, the leading digits or set of digits follow a distribution in a successively decreasing manner, with number 1 having the highest frequency. As an example, take the population of all countries. The data is collected from a Kaggle location, and leading integers are pulled out as follows:

pop_data <- read.csv("./population.csv")

ben_data <- pop_data %>% select(pop = `Population..2020.`)
library(stringr)
ben_data$digi <- str_extract(ben_data$pop, "^\\d{1}")
ben_data$digi <- as.integer(ben_data$digi)

The next step is to plot the histogram using the extracted digits.

Let’s not stop here, extract the first two digits and plot.

Benford’s Law Read More »