We saw the empirical rule – Gutenberg-Richter relationship – in the last post. Today, we use the wealth of data from the ANSS Composite Catalog to demonstrate a super cool feature of R – the mapview(). To remind you, this is how the data frame appears.
Now, let’s ask: where did the biggest, say, 9 and above magnitude quakes occur? To answer that, we need two packages, “sf” and “mapview”.
Charles Francis Richter and Beno Gutenberg, in 1944, found some interesting empirical statistics about earthquakes. It was about how the magnitude of earthquakes related to their frequencies. Today, we revisit the topics using data downloaded from ANSS Composite Catalog (364,368 data from 1900 – 2012).
A histogram of the magnitude is below.
The next step is to generate annual frequency from this. Since the data is from 1900-2012, we will divide the frequency by 112 to get the desired parameter. The following R codes provide the steps till the plot is generated. Note that the Y-axis is in the log scale.
We have learned mathematically that at the Roulette table, the house always wins, yet we spent countless minutes watching YouTube videos learning strategies to beat the wheel. We also watched financial analysts all day on TV, reasoning on hindsight and glorifying market-beating fund managers, forgetting they were just the survivors of Russian roulette. The same people continue to make us believe in momentum and hot hands.
People gamble and play the lottery, where they are guaranteed to lose, and fail to invest for their retirement, where they are guaranteed to win. Three-quarters of Americans believe in at least one phenomenon that defines the law of physics, including psychic healing (55 per cent), extrasensory perception (41 per cent), haunted houses (37 per cent), and ghosts (32 per cent).
Rationality, by Steven Pinker
We have seen how journalism can mesmerise readers by reporting an 86% increase in myocarditis for the vaccinated, a 300% increase in thrombosis over oral contraceptives, or an 18% risk of colorectal cancer by eating processed meat. We just became easy prey for our inability to make decisions based on risk-benefit trade-offs and the eternal confusion between absolute and relative risks.
Even in an era of open data, data science and data journalism, we still need basic statistical principles in order not to be misled by apparent patterns in the numbers.
The Art of Statistics: How to Learn from Data, by David Spiegelhalter
The author was referring to variabilities in the observed rates of events when the population is small, which is the concept behind funnel plots.
We understand that international trade is a win-win for both parties, yet we let free rein to populism and Brexit. We know that the Muslim community in India is on the fastest downhill in the fertility curve, yet we want to believe that the opposite is true and continue believing in one-child policies.
We also know that life is not a zero-sum game and that probability theory is not another useless thing you study in schools and forget later, but it is about how we make decisions and appreciate life. The understanding, or the lack of it, can be a choice between life and death, as we have just witnessed in the global pandemic.
Could everyone have a fact-based worldview one day? Big change is always difficult to imagine. But it is definitely possible, and I think it will happen, for two simple reasons. First: a fact-based worldview is more useful for navigating life, just like an accurate GPS is more useful for finding your way in the city. Second, and probably more important: a fact-based worldview is more comfortable.
Factfulness, by Hans Rosling with Anna Rosling Rönnlund and Ola Rosling
The trolley problem is a thought experiment in ethics about a scenario in which an onlooker has a chance to save five people being hit by a runaway trolley by diverting it to another track, hitting one person.
The fallacy of dilemma
It is an informal fallacy in which the proponent restricts the options to choose into a few, say, two. It is a fallacy because the framing of the premise is erroneous.
Back to the trolley
In my view, the trolley problem is a false dichotomy (two options) problem that does two things. It forces you to believe that there are only two options – kill five or kill one. It then helps you to justify killing the one as one generous act to save five. And this has been consistently practised by political leaders, especially of the oppressor types, to push their malicious agenda whilst satisfying the collective imagination of the majority.
Dealing with the trolley
The best way to deal is to resist the premise. Why are there diversions or two tracks? Why are there only two tracks? Why is the onlooker not closer to the five so she can save them (by pushing or something)? Why does only the diversion switch work and not the stopping switch?
We have been seeing some marvellous acts of bio-detectives in recent years. In yet another monumental feat of locating the proverbial needle in the haystack, scientists of the Eberhard Karls University of Tübingen have unearthed the origins of the bubonic plague of the mid-14th century.
In a paper published yesterday in the prestigious journal Nature, Spyrou et al. describe how DNA sequences of samples from seven individuals exhumed from two of the cemeteries in Kara-Djigach and Burana of the modern-day Kyrgistan.
The team collected the tooth samples from Peter the Great Museum of Anthropology and Ethnography in St Petersburg. The specimens were excavated between 1885 and 1892. The tombstone inscriptions suggest that the victims were dead between 1338 and 1339. DNA extractions were done from the tooth powder using standard extraction reagents, and voila: they see DNA sections of Yersinia pestis (Y. pestis), the bacterium responsible for killing about 60% of the population of western Eurasia!
What is more? The study identified the DNA as the common ancestor to the bacteria strains that ran havoc in central Eurasia.
The source of the Black Death in fourteenth-century central Eurasia: Nature
The gulf between what we all like to believe and what happens can be wide. We have seen this before in the one-child policy of China. We called it the claim instinct. Because it contained the perfect recipe – a mighty leader, an intervention and results that fitted a narrative.
We look at a similar one today – that of benevolent dictator. The phrase may sound like an oxymoron for anybody who lives in the modern world. The benevolent autocrat is a school of thought on leadership, and its proponents take examples from countries such as Singapore as their test case. As per this school, these well-intended rulers bring higher economic prosperity to their countries.
The paper written by Rizio and Skali examined this claim by collecting data from 133 countries over 150 years starting from 1858. Their mathematical analysis consisted of three variables – rulers (taken from Archigos database), political regime (Polity IV dataset), and GDP per capita (Maddison dataset).
Misguided belief in dictators
The results showed that good dictators brought prosperity no different from what chance would have made. At the same time, bad dictatorships showed a clear negative impact on the economy.
References
S.M. Rizio and A. Skali, The Leadership Quarterly 31 (2020) 101302 Introducing Archigos: A Dataset of Political Leaders Polity IV Individual Country Regime Trends Maddison Project Database 2013
Industrial melanism is a term to familiarise. Biston betularia, the “poster moth” of evolution through natural selection, made this word immortal. You may call it a victim of the Industrial Revolution (or the coal pollution of England). However, the transformation of this humble creature provided the most powerful illustration of the theory of evolution and accelerated its inevitable journey towards becoming a theorem.
To give a brief background: Biston betularia is a type of peppered moth that had transformed from its pale (typica) form to black (carbonaria) in the last decades of the nineteenth century, coinciding with the industrial revolution in England. The hypothesis for the observed shift is that the pale varieties became prey to the bird predators as the former had become easily distinguishable on the blackened walls of industrialised cities of England, thanks to the coal revolution (and pollution). Accidental mutant varieties with black shades saved themselves from the lookout of the predators and became the most abundant species in the 20th century and continued until a few decades ago.
We have seen it before but repeating. Polymorphism is where two individuals differ in their DNA sequence, and the less common variant is present in at least one per cent of the people tested. The simplest type of polymorphism is when there is a single-letter change in a genetic sequence. That is called a Single Nucleotide Polymorphism (SNP).
Scientists have recently discovered the locations (the sequence and the genes) of the mutations that caused the change of colour from pale to dark. Further, analysis by statistical inference has found that the transposition happened around 1819, consistent with the actual observation of the change (from the dominance of the pale population to the black).
Noone sees its evolution!
The story of the peppered moth’s evolution is both fascinating and confusing. First, we need to realise that an individual white moth never transforms into a back one in its lifetime; the celebrated illustration (The Road to Homo Sapiens) of Rudolph Zallinger may tell you otherwise. It was a crime, though unknowingly, the artist committed against science that etched this faulty image – of an ape transforming into an upright man – permanently into the human psyche. Evolution is not a conscious conversion of one species to another. For example, the original white-moth-dominated society and the new black-dominated can easily have a hundred generations of separation.
Humans, the moths of glass sponges
We can see a moth’s evolution in front of us because a moth has a short lifetime – a few months at the maximum. In other words, given a few decades, we could see a few hundred life cycles of moths. Human evolution is not visible to humans because we can never see a thousand generations of ourselves unfolding before us. That is why we go after evidence, and science delivers. In doubt, ask a glass sponge who has survived this planet for 10,000 years!
The industrial melanism mutation in British peppered moths: Nature
In my opinion, the Monte Hall problem was not about probability. It was about prejudices.
The trouble with reasoning
Logical reasoning has enjoyed an upper hand over experimentation due to historical reasons. Reasoners and philosophers commanded respect in society from very early history. It was understandable, and science, the way we see it today, was in its infancy. Experimentation and computation techniques did not exist. But we continued that habit even when our ability to experiment – physical or computational – has improved exponentially.
I have recently read an article on the Monty Hall problem, and in the end, the author remarked that the topic was still in debate. I wonder who on earth is still wasting their time on something so easy to find experimentally or by performing simulations. Make a cutout, collect a few toys, call your child for help, do a few rounds and note down the outcome. There you are and the great philosophical debate.
Thought experiments are thoughts, not experiments!
Thought experiments, if you can do some, are decent starting points to frame actual experiments and not the end in itself. The trouble with logical reasoning as the primary mode of developing a concept is that it creates an unnecessary but inevitable divide between a minority who could understand and articulate the idea and a large group of others. Evidence that emerges from experiments, on the other hand, is far convincing to communicate to people. The debate then shifts to the validity and representativeness of the experimental conditions and the interpretation of results.
Monte Hall is relevant
The relevance of the Monty Hall problem is that it tells you the existing deep-rooted prejudices and sexism in society. The topic should be discussed but not as an example for budding logical reasoning or the eloquence of mathematical language. If someone doubts the results, which is very ‘logical’, the recommendation should be to conduct experiments or numerical simulations and collect data.
Philosophy, like psychology, has played its role in the grand arena of scientific splendour as the main protagonist. The time has come for them to take the grandpa roles and give the space for experimentation and computation.
The blame instinct drives us to attribute more power and influence to individuals than they deserve, for bad or good. Political leaders and CEOs in particular often claim they are more powerful than they are.
Hans Rosling from the book Factfulness
Blame instinct and claim instinct! For a modern-day leader, be it a politician or a CEO, the former brings the power, and the latter keeps it. In one of the previous posts, we have looked at the unsubstantiated blame against Muslims in India and the reality of population growth. This time we look at the other side, the claim factories and the success of child-control policies.
Most of you are familiar with the one-child policy of China and the ‘blockbuster’ success that it brought. I remember this message used to echo everywhere when I was growing up in the eighties. Interestingly, even today, after all these years, when so much data are publically available for free that rejected the whole notion, some leaders maintain the rhetoric.
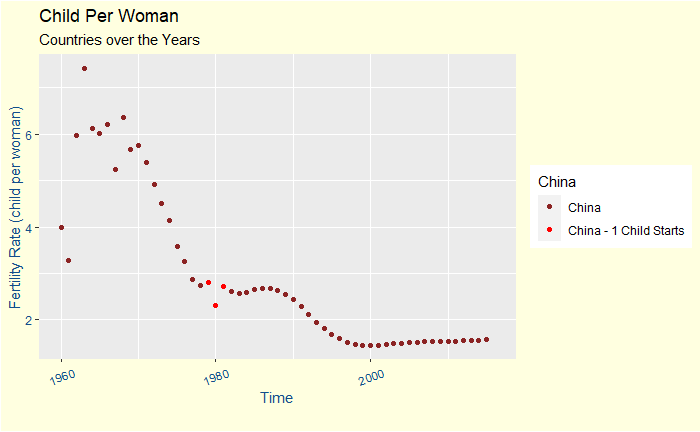
Come back to the China report. The following is a plot of the fertility rate of women in China from 1960 to 2016. For complete data and visualisations, go to the gapminder website.
As per Wikipedia, the Chinese government started the policy in 1980. In the plot, I’ve marked three years – 1979, 1980 and 1981 – in red to show, in the big picture, the timing when the government was implementing the policy. The Chinese women fertility rates have been on a sliding-down path since the 70s. The policy of 1980 may have only reduced its pace, but that I leave to your imagination.
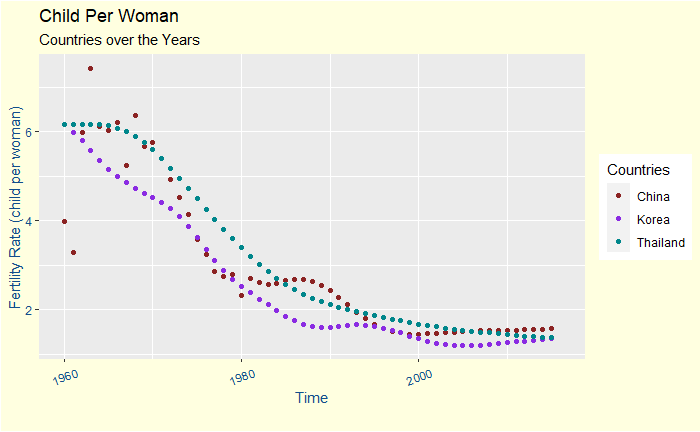
My claim above based on a plot is not entirely bulletproof. It is impossible to show that the policy did not work as the child per woman was either kept low or decreased during the period. To discover the results and remove any anomalies, we must compare the trend with other countries. So, let’s examine two countries in East Asia that did not impose such a burden on their people – South Korea and Thailand.
Did it stop in South Korea and Thailand? No, the whole of Asia has shown declines in female fertility since the middle of the twentieth century.
Thoughtful Examinations of Data
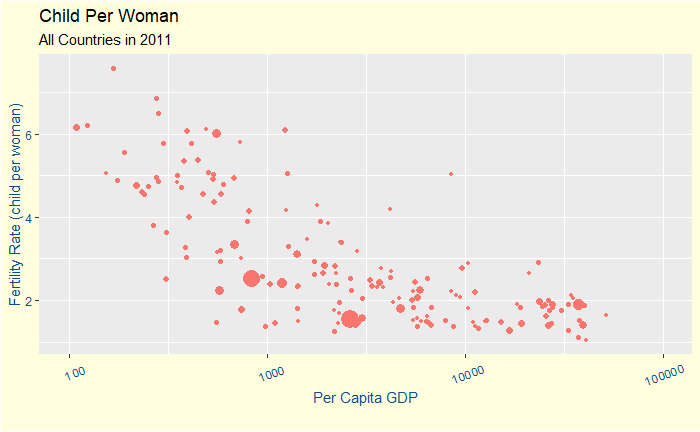
The results show the power of evidence and reflect the time we are living, the age of free and publically available data. The data showed beyond doubt that economic status and education are stronger predictors of smaller families than other popular beliefs, such as religion or strong rulers.
The size of the symbol represents the population of the country.
In simple words, when a mother is educated and financially independent enough to know that her society has the means to get her children to pass their childhood, she starts to prefer a smaller family! A family that can have a quality life and where the children can climb the social and economic ladder.
Why are Claims So Powerful?
It is so convenient. Something that happened without any intervention from the all-powerful is difficult for humans to admit, especially for the powerful humans! The public also believes them as the claims go hand in hand with the almighty image of the powerful.
Mixing is the reality of life; pure only exists in our imagination.
Humans have this love for purity and feel shame about the undeniable reality of mixing. While people in some parts of the world are proud of eating a ‘purely’ vegetarian diet, others list everything they could recollect from their harddisks to proclaim their superior ancestry. They are all right, but only for a negligibly short duration in history. Human history does not give a damn about vegetable eaters, and the same for any exclusive ancestry!
A landmark research paper came out in September 2019 in the journal Science titled, ‘The formation of human populations in South and Central Asia’. It was a report based on ancient DNA data from 523 individuals spanning the last 8000 years, from Central Asia and northernmost South Asia.
Migration of Yamnaya Steppe Pastoralists
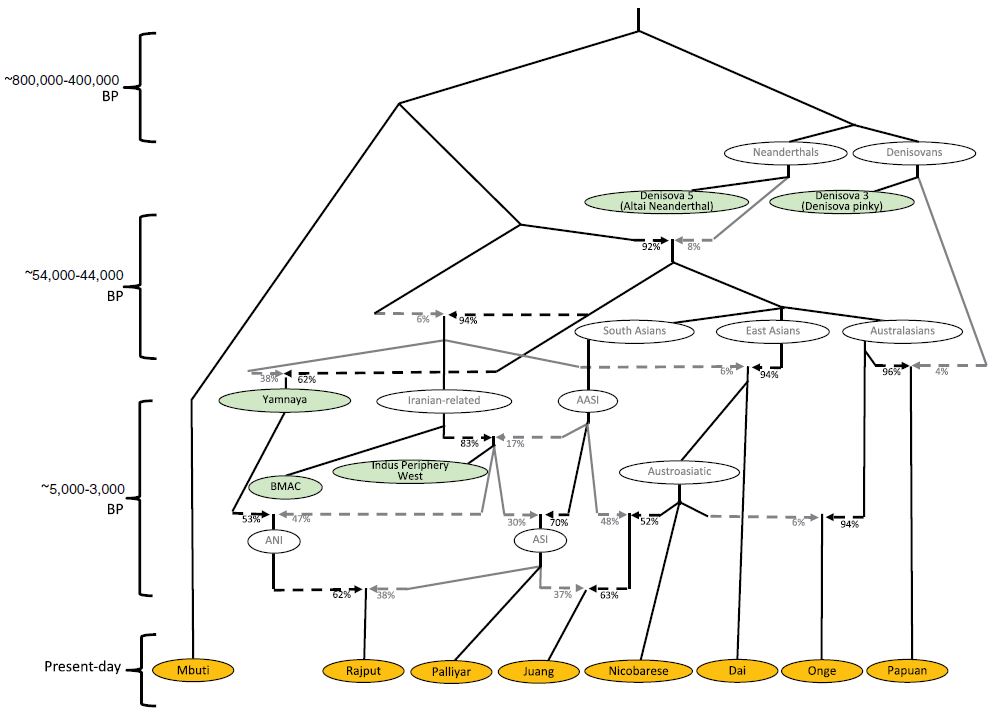
The paper was primarily on the migration of the Eurasian Steppe to South Asia around 3000 years ago. The ‘Steppe Ancentry’ or Yamnaya culture was active around 5000 years ago in present-day Ukraine and Russia. The folks from that region had travelled to either side of the world, to Europe and South Asia. Today we talk about the guys and, perhaps some girls, who migrated to the east.
It is relevant here to talk about another DNA study published in Nature in 2009. This study genotyped 125 DNA samples of 25 different groups of India and did what is known as a Principal Component Analysis (PCA) of the data. Based on the similarities of the allele, they found a relationship between people of the North and South of India. An ancestral component, they call it ANI (Ancestral North Indian), varied from 76% for the North to 40% in the south. The remaining fraction is the ASI (Ancestral South Indians). Note that a ‘Pure’ ASI, closer to the earliest humans (travelled from Africa, of course), was not seen in that study.
Where are those people? That is next
Flashback
ASI was ‘ruling the land’ and Indus Valley Civilisation (IVC) was flourishing when the Steppe folks arrived in present-day India. But that would change soon, and the visitors would form a mix, which is the base of the continuous band from North to South that we saw earlier. So was ASI was the original one? The answer is a firm NO. ASI was a mix of what is known as AASI and a group of people with Iranian farmer ancestry. And who were this AASI? Well, they were the people who came 40,000 years ago, yes, from the cradle of homo sapiens, Africa. Of course, the Iranian farmers also went from Africa, but a few tens of thousands of years earlier.
Piecing All Together
The following picture, copied from the Science paper, summarises the whole story.
Why Is It Important?
It is always fun to learn more and more about the incredible spread of homo sapiens from Africa to the rest of the world. It is equally wonderful to note how dynamic was the intermixing of population. Also, notice one irony. These results, the vivid stratification of ANI and ASI, were possible due to their obsession with endogamy in the last few hundred years. That way, they preserved the signatures of the founders or else it would have been a complete mixing of genes.
The formation of human populations in South and Central Asia: Science