June 2022

Based on a Lancet Study …

In this post, we talk about an article that otherwise requires no special mention in this space. Yet, we discuss it today, perhaps as an illustration of 1) the diverse objectives that scientific researchers set for their work and 2) how the ever imaginative media, and subsequently the public, could interpret the massages. Before we examine the motivation or the results, we need to understand something about the publication status of the study.

Preprints with The Lancet 

It is a non-peer-reviewed work or preprint and, therefore, is not a published article in the Lancet, at least for now. The SSRN page, the repository at which it appeared, further states that it was not even necessarily under review with a Lancet journal. So, a preprint with The Lancet is not equivalent to a publication by the Lancet.

The motivation

You may read it from the title; Randomised clinical trials of COVID-19 vaccines: do adenovirus-vector vaccines have beneficial non-specific effects? It is a review paper, and the investigators specifically wanted to understand the impact of Covid-19 vaccines on non-covid diseases, which, I think, is a valid reason for the research. By the way, you have every right to ask why Covid-19 vaccines should impact accidents and suicides!

Motivated YouTubers

The following line from the abstract turned out to be the key attraction for the YouTuber scientist. It reads: “For overall mortality, with 74,193 participants and 61 deaths (mRNA:31; placebo:30), the relative risk (RR) for the two mRNA vaccines compared with placebo was 1.03“. Now, ignore the first three words, “For overall mortality”, add The Lancet, and you get a good title and guaranteed clicks! 

The results

First, the results from mRNA vaccines (Pfizer and Moderna):

Cause of
death
Death/total
Vaccine group
Death/total
Placebo group
Relative
Risk (RR)
Overall mortality31/3711030/370831.03
Covid-19 mortality2/371105/370830.4
CVD mortality16/3711011/370831.45
Other non-Covid-19
mortality
11/3711012/370830.92
Accidents2/371102/370831.00
Non-accidents,
Non-Covid-19
27/3711023/370831.17

In my opinion, the key messages from the table are:
1) The number of deaths due to Covid-19 is too small to make any meaningful inference
2) The deaths due to other causes show no clear trends upon vaccination

Results from adenovirus-vector vaccines (several studies combined):

Cause of
death
Death/total
Vaccine group
Death/total
Placebo group
Relative
Risk (RR)
Overall mortality16/7213830/500261.03
Covid-19 mortality2/721388/500260.4
CVD mortality0/721385/500261.45
Other non-Covid-19
mortality
8/7213811/500260.92
Accidents6/721386/500261.00
Non-accidents,
Non-Covid-19
8/7213816/500261.17

My messages are:
Accidental accumulation of non-Covid-19-related deaths (five of them coming from cardiovascular) gives an edge to the vaccine group and, therefore, “saves” people immunised with Adenovirus-vector vaccines from dying from other causes, including accidents, in some countries! The statistical significance of the number of cases is dubious.

Lessons learned

1) Be extremely careful before accepting commentaries about scientific work (including this post)
2) As much as possible, find out and read the original paper after being enlightened by YouTube teachers.

Randomised clinical trials of COVID-19 vaccines: do adenovirus-vector vaccines have beneficial non-specific effects?: Benn et al.

Based on a Lancet Study … Read More »
Risks vs Benefit – mRNA Against CoVid-19

You may read this post as the continuation of the one I made last year. Evaluate the risk caused by an action by comparing it with situations without that action. That is the core of the risk-benefit trade-off in decision-making. A third factor is missing in the equation, namely, the cost.

A new study published in The Lancet is the basis for this post. The report compiles the incidents of myocarditis and pericarditis, two well-known side effects linked to the mRNA vaccines against COVID-19. The data covered four health claim databases in the US and more than 15 million individuals.

The results

First, the overall summary: the data from four Data Partners (DP) indicate 411 events out of the 15 million studied who received the vaccine. Details of what is provided by each of the DPs are,

Data Partner
(DP)
Total vaccinatedTotal Observed
myocarditis or
pericarditis
events (O)
Expected
events (E)
(based on 2019)
O/E
DP16,245,406154N/A
DP22,169,3986424.96 2.56
DP33,573,0979440.08 2.35
DP43,160,4689944.612.22

I don’t think you will demand a chi-squared test to get convinced that the two mRNA vaccines have an adverse effect on heart health. Age-wise split of the data gives further insights into the story.

Age-groupObserved EventsTotal vaccinatedIncident Rate
(per 100,000)
Expected Rate
(per 100,000)
18-25153 1,972,410 7.760.99
26-3562 2,587,814 2.40 0.95
36-4563 3,226,022 1.951.11
46-5562 3,597,292 1.721.3
56-64713,764,8311.891.63

The relative risk is much higher for younger – 18 to 35 – age groups. But the absolute risk of the event is still in the single digits per hundred thousand. And this is where we should look at the risk-benefit-cost trade-off of decision-making.

The risk

First and foremost, don’t assume all those 411 individuals died from myocarditis or pericarditis; > 99% recover. To know that, you need to read another study published in December 2021 that reported the total number of deaths to just 8! So, there is a risk, but the absolute value is low. The awareness of the risk should alert the recipients that any discomfort after the vaccination warrants a medical checkup.

The benefit

It would be a crime to forget the unimaginable calamity that disease has brought to the US, with more than a million people dying from it. A significant portion of those deaths happened prior to the introduction of the vaccines, and even after, the casualties were disproportionately harder on the unvaccinated vs the vaccinated.

The cost

At least, in this case, the cost is a non-factor. Vaccine price, be it one dollar or 10 dollars, is way lower than the cost of the alternate choices, buying medicines, hospitalisation or death.

Managing trade-off

Different countries manage this trade-off differently. Since the risk of complications due to COVID-19 is much lower for children and the youth, some allocate a lower priority to the younger age groups or assign a different vaccine. However, it is recognised that avoiding their vaccination altogether, due to their low-risk status, is also not an answer to the problem. It can elevate the prevalence of illness in the system and jeopardise the elders with extra exposure to the virus.

References

Risk of myocarditis and pericarditis after the COVID-19 mRNA vaccination in the USA: The Lancet

Myocarditis after COVID-19 mRNA vaccination: Nature Reviews Cardiology

How to Compare COVID Deaths for Vaccinated and Unvaccinated People: Scientific American

Risks vs Benefit – mRNA Against CoVid-19 Read More »

The Responsibility Bias

It is a commonly observed phenomenon where people claim more credit for their contributions to collecting activities than they deserve. Examples are partners taking more than 50% credits inside marriage relationships, award-winning personalities resisting giving enough credits to their collaborators etc.

The person I see every day

Responsibility bias does not necessarily emerge out of the evilness of an individual. However, it is exacerbated by their ego – too much focus on themselves. Understandably, the quantity of information that a person has on herself is more than what she has on other people. And if she fails to recognise that fundamental disparity, she is expected to make the mistake of shunning others.

Perspective thinking

Noticing and acknowledging the contribution of others requires deliberate effort. One of the techniques is to deliberately consider the members in the group as individuals, not just the ‘rest of the group’.

This is what Caruso and Bazerman at Harvard observed this phenomenon in their investigations on perspective-taking with academic collaborators. They selected articles with three to six authors from five journals, and questionnaires were sent to the writers asking about their experience with the author group.

The questionnaire was divided into 2: 1) self-focused, in which the receivers were asked to write about their contribution (in percentages), and 2) other-focused, in which the subject was first given a task to write down the names of the co-contributors and then about their contributions, including themselves. As a measure, the participants were asked two questions: 1) how much they enjoyed the work and 2) if they were willing to collaborate on a future publication.

As predicted by the investigators, on average, the self-focused group had allocated a higher responsibility to themselves compared to the other-focused.

References

The costs and benefits of undoing egocentric responsibility assessments in groups: Caruso and Bazerman
Give and Take: Adam Grant

The Responsibility Bias Read More »

The Ultimatum Game – The Kahneman Experiment

In yet another Kahneman experiment, the team tried to play the ultimatum game with a group of psychology and business administration students. If you forgot what the game was, here is the description.

The game

Experiment 1

In their experiment, player A got paired with player B at random. There were several pairs. Each duo got $10 that could be divided between the two as proposed by one of the pairs. If player A allocated the division and was acceptable to player B, the payoffs were done accordingly. If the proposed division was unacceptable to player B, neither got anything.

Much to the surprise, because it violated the standard game theory prediction, the researchers found that the majority (75%) of the participants split the offers equally. There were also rejections of some of the proposals.

Experiment 2

The experiment had two parts. The first part was the ultimatum game with a few differences. The subjects only got two possibilities to divide $20: 18:2 or 10:10. And the receiver had no option to reject. In the second part, the participants were matched with two others. She then got a chance to split $12 evenly between herself and the person (the unfair one) who gave away $2 in the previous game (if one of them happened to be in the match) or to split $10 evenly with the even-splitters (the fair ones) of the earlier part.

76% of the people split evenly in the first part of the experiment. In the second part, there was a clear preference (74%) to punish the unfair allocators even when that would mean a $1 cost to the allocator.

The Ultimatum Game – The Kahneman Experiment Read More »

The Ultimatum Game

Adam Grant, in his best-selling book, Give and Take, describes the behavioural characteristics of three types of humans based on their attitudes towards other people – takers, matchers and givers. According to the author, takers give away (money, service or information) when the benefits to themselves are far more than the personal costs that come with the transfer. Givers, on the other extreme, relish the value to others more than the personal cost to themselves. Naturally, the matchers are in between – strictly reciprocating.

Grant reference to a paper published by Kahneman et al. in 1986 based on a concept called the ultimatum game, a well-known idea in game theory. Today we will look at the game. And we’ll discuss the study result on another day.

The game

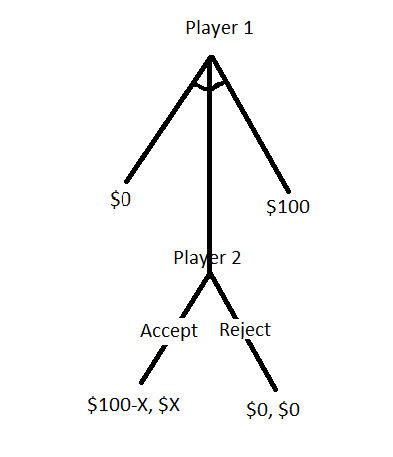
We will illustrate the concept through a 100-dollar game. Player 1 (donor) gets 100 dollars, and she can offer – anything from 0 to 100 – to player 2 (receiver). If player 2 accepts, she gets it, and player 1 takes the rest (100 – X). If player 2 rejects the offer, then no one gets anything.

Rationality vs sense of fairness

If the receiver was rational, her acts would have been governed by her self-interest, as expected by economics theories, and take whatever was offered. After all, something is better than nothing. But, this doesn’t happen always. There is a limit to the offer below which the receiver may feel the injustice by the donor.

Further Reading

Give and Take: Adam Grant
Ultimatum Games: William Spaniel

The Ultimatum Game Read More »

Newcomb’s Paradox

The paradox was created by William Newcomb and was first published by Robert Nozick in 1969.

Imagine there is a being that has the superpower to predict your choices with high accuracy, and you know that. There are two boxes, B1 and B2. You know that B1 contains 1000 dollars and B2 carries either one million dollars or nothing. You have two choices: 1) take what is inside both the boxes or 2) only take what is in the box B. Further, it is a common knowledge that:
1) If the being predicts that you will take both the boxes, it will not add anything to box B
2) If the being knows you will only take box B, it will add a million dollars to it.

I guess you remember the definition of common knowledge: you know that he knows that you know stuff!

What will you choose?

There are two possible arguments for leading to two different decisions.
1) You know the being will read your mind and put nothing in B if you choose both the boxes and add a million if only B is chosen. So select option 2 (select box B).
2) The being has already made the decision (after reading your mind), and the only way for you to minimise the damage is to select option 1 (select both the boxes).

In polls conducted to understand their preferences, people often tied at 50:50; there are takers for both options. But why is that?

Dominance principle

Let’s first write down the payoff matrix.

The Being
predicts
you take B
The Being
predicts
you take both
You take Box B1 million0
You take both1 million +
1000
1000

The dominance principle states that if you have a strategy that is always better, you make a rational decision to choose that. In this case, that is taking both boxes.

Here is a thought experiment to explain this perspective. Imagine the other side of the box is transparent, and your friend is standing on that side. She can see the amount inside. Although she can’t tell you anything, what would she be hoping for? Well, if she sees that the being had put a million in box B, you would be better off taking that box and the one that carries 1000. If She finds the being did not add anything, she would still like you to take both the boxes to win the guaranteed 1000.

Expected value theory

While the expected utility theory is better suited to describe situations like these, I have gone for the expected value theory as I find it easier to explain things. We estimate the expected value of each action by multiplying the value by its probability. Imagine you trust the being is accurate at 90%, the following two calculations get you the value of your decision, and you choose what gives the highest.

You take B0.9 x 1,000,000 + 0.1 x 0
= 900,000
You take both0.9 x 1000 + 0.1 x 1,001,000
= 101,000

Therefore, you select only box B.

Newcomb’s Problem and Two Principles of Choice: Robert Nozick
Newcomb’s Paradox – What Would You Choose?: Smart by Design

Newcomb’s Paradox Read More »

Ambiguity Aversion

Ellsberg and Allais paradoxes have one thing in common – both reflect our ambiguity aversion. Given the opportunity to choose between a ‘sure thing’ and an uncertain one, people tend to pick the former. Or it is the behaviour characteristics that dictate your decision-making when the probability of the outcome is known vs it is unknown; a feeling that tells you an uncertain outcome is a negative outcome.

In the case of the Ellsberg paradox, people are happy to bet on the red ball when they know the risk (33% chance) against the ambiguity surrounding the black and yellow. The same people had no issue dumping the mathematically identical option (red) when they knew there was a 60% chance of getting 100 if they went for one of the others.

In the case of the Allais, it was a fear imposed by a 1% chance of getting nothing. If you want to know that fear, let’s take the case of a vaccine that can give a 10% chance of 5-year protection, 89% chance of 1-year protection and a 1% chance of no protection, or worse, a 1 in a million probability of death! If that was placed side by side with another one that guarantees 1-year protection to all, without any known side effects, guess what I would go for.

Ambiguity Aversion Read More »

Allais Paradox

You have two choices: A) A lottery that guarantees $ 1 M vs B) where you have a 10% chance of winning $ 5M, 89% chance for 1 M and 1% chance of nothing. Which one will you choose? If I write them in a different format:

A$ 1M (1)
B$ 5M (0.1); $ 1M (0.89); $ 0 (0.01)

Having chosen one of the above two, you have another one to choose from. C) A lottery with an 11% chance of $ 1 M and 89% chance of nothing vs D) a 10% chance of winning $ 5M, 90% chance of nothing.

C$ 1M (0.11); $ 0M (0.89)
D$ 5M (0.1); $ 0 (0.9)

Allais (1953) argued that most people preferred A and D. What is wrong with that?

Expected Value

If the person had followed the expected value theory, she could have chosen B and D:

A) $ 1M x 1 = $ 1M
B) $ 5M x 0.1 + $ 1M x 0.89 + $ 0 x 0.01 = $ 1.39 M
C) $ 1M x 0.11 + $ 0M x 0.89 = $ 0.11 M
D) $ 5M x 0.1 + $ 0 x 0.9 = $ 0.5 M

Expected Utility

Since the person chose A over B, clearly, it was not the expected value but an expected utility that governed her. Mathematically,

U($ 1 M) > U($ 5 M) x 0.1 + U($ 1 M) x 0.89 + U($ 0M) x 0.01

Now, collect the U($ 1 M) on one side, add U($ 0M) x 0.89 on both sides, and simplify.

U($ 1 M) – U($ 1 M) x 0.89 > U($ 5 M) x 0.1 + U($ 0M) x 0.01
U($ 1 M) x 0.11 > U($ 5 M) x 0.1 + U($ 0M) x 0.01
U($ 1 M) x 0.11 + U($ 0M) x 0.89 > U($ 5 M) x 0.1 + U($ 0M) x 0.01 + U($ 0M) x 0.89
U($ 1 M) x 0.11 + U($ 0M) x 0.89 > U($ 5 M) x 0.1 + U($ 0M) x 0.9

Pay attention to the last equation. What are you seeing here? The term on the left side is the expected utility equation corresponding to option C, and the one on the right side is option D. In other words, if A > B, then C > D. But that was violated in the present case.

Allais Paradox Read More »

Ellsberg Paradox

Imagine an urn containing 90 balls: 30 red balls and the rest (60) black and yellow balls; we don’t know how many are black or yellow. You can draw one ball at random. You can bet on a red or a black for $100. Which one do you prefer?

RedBlackYellow
A$100$0$0
B$0$100$0

Ellsberg found that people frequently preferred option A.

Now, a different set of choices: C) you can bet on red or yellow vs D) bet on black or yellow.

RedBlackYellow
C$100$0$100
D$0$100$100

Most people preferred D.

Why is it irrational?

If you compare options A and B, you can ignore the column yellow because they are the same. The same is the case for C vs D (ignore yellow as they offer equal amounts). In other words – if you had preferred A, logic would suggest you choose C and not D.

RedBlack
A$100$0
B$0$100
C$100$0
D$0$100
A = C; B = D

The second way is to look at it probabilistically. If you chose option A, you are implicitly telling that the probability of Red is more than the probability of Black. If that is the case, in the second exercise, the probability of Red or Yellow has to be greater than the probability of Black or Yellow. But you violated the law with your preference.

Decision under uncertainty

Clearly, the decision was not made based on probability or expected values. What is common for B and C is the perception of ambiguity. In the case of A, there is no 30% guarantee for a Red. In the case of D, there is a 60% guarantee to win $100.

Ellsberg Paradox Read More »

Gambler’s Ruin

Similar to the previous two posts, although the premise is slightly different. A gambler starts with n dollars and bets dollar 1 at a time. She will quit under one of the two circumstances – 1) lose it all (0 dollars) or 2) reaches the target of N dollars.

Let’s first understand the conditions. You go to a casino and play even money on a Roulette wheel (payoff 1 to 1). You have 10 dollars in your purse, which is your capital. You start betting 1 dollar at a time. If you win, you add a dollar to the capital, and if you lose the bet, you lose one from it. When you reach your target, say 100, or lose all your money, you quit and go home. It is easy to realise that you can not start if your starting capital is 0 or 100. In the former case, you don’t have money to bet, and in the latter, you have already achieved the target!

Random walk

We use the random walk method to establish an analytical relationship for the probability. Imagine a random walk starts from a position xj, corresponding to a starting fortune of j dollars. Depending on a win, loss, or a tie, the person will move to xj+1, xj-1 and xj with probabilities of p, q and r, respectively. Therefore,

xj = P(Aj|win) x P(win) + P(Aj|loss) x P(loss) + P(Aj|tie) x P(tie)

xj = xj+1 x p + xj-1 x q + xj x r

Total probability, p + q + r = 1; r = 1 – (p + q)

xj = xj+1 x p + xj-1 x q + xj – (p+q) xj

p xj+1 – (p+q) xj + q xj-1 = 0

It is a quadratic equation for xj = k(j=1) . By substituting the values and performing the necessary manipulations, you get the final probability of reaching the target (quitting at N or 0).

P = \frac{1-(q/p)^n}{1-(q/p)^N}; p \neq q

For even-money bets

The winning probability is just under 50% (18/38). The chances of achieving your target of 100 from four different starting points, 10, 25, 50, and 93.5, are:

Starting AmountProbability
(to reach 100)
100.00005
250.0003
500.005
93.50.5
At 93.5, you have a 50:50 chance to make 100!

Bold vs cautious

An important takeaway from this calculation is the strategy of how you may want to bet to maximise your chance of reaching 100. E.g., you start with 10 dollars and have two choices: 1) place 10-dollar bets or 2) place 1-dollar bets. In the first case, you bet ten times, and in the second case, a hundred.

\text{The probability of winning 100 in 10 dollar bets starting with 10 is (n = 1 and N = 10)} \\ \\ x_{10} = \frac{1-[(18/38)/(18/38)]^1}{1-[(18/38)/(18/38)]^{10}} = 0.06 \\ \\  \text{The probability of winning 100 in 1 dollar bets starting with 10 is (n = 10 and N = 100)} \\ \\ x_{10} = \frac{1-[(18/38)/(18/38)]^{10}}{1-[(18/38)/(18/38)]^{100}} = 0.00005

You better be bold and play larger sums fewer times than otherwise. Well, it is not new; the house always wins in the long term!

Gambler’s Ruin Read More »