A 42-year-old mother of two, Sophie goes to a cancer screening centre in Los Angeles and does a mammogram. The results came in with bad news; she is positive for breast cancer. Still puzzled, she enquires the laboratory technician about the accuracy of the analysis. The technician says that the machine used for the test was 95% correct for detecting positives and 90% accurate for detecting negatives. What should she do now? What is the probability that she has breast cancer?
Bayes’ Theorem
Before we get into what happened next in Sophie’s story, let’s try to understand one of the most important equations in statistics. I will write down the equation below. Just memorise it as if your life depended on this.
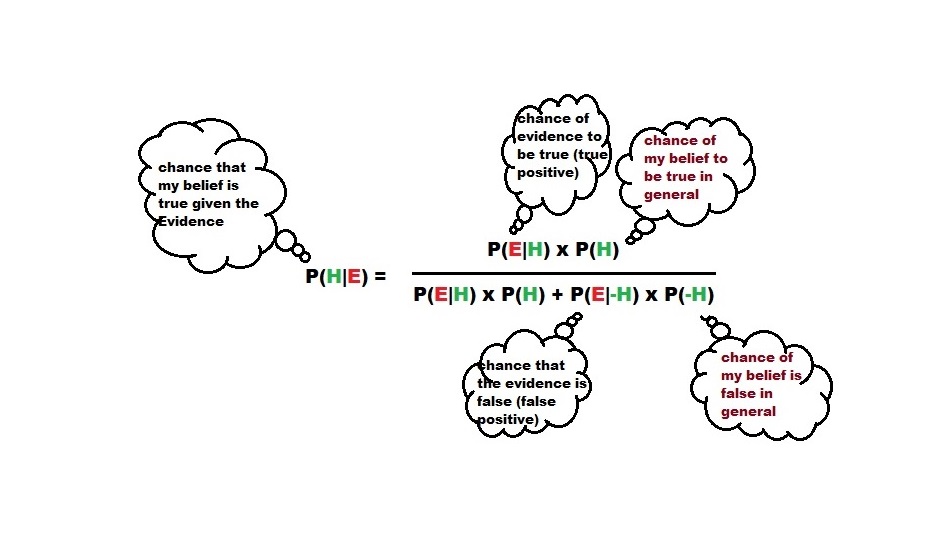
P (H|E) = P(E|H) P(H) / [ P(E|H) P(H) + P(E|-H) P(-H) ]. The letter P denotes probability, H the hypothesis (belief) and E the evidence (test results).
The equation is known as Bayes’ theorem, named after the famous 18th-century English statistician Thomas Bayes.
Quantify Your Beliefs
Now, let’s understand the equation and apply it to Sophie’s case. Let’s get the first term, P(E|H). P(E|H) is the chance of getting positive results for people who have breast cancer, something the technician told her, i.e. 95%. Note that this equals 0.95 if expressed as a fraction and is handy for our calculations. They call it the sensitivity of the test. The following term, P(E|-H), is the chance of getting a positive result despite having no breast cancer. Remember, the technician gave Sophie another number – 90% accuracy for catching negatives. They call it the specificity of the test. It tells you that for 100 healthy people, the machine correctly gives 90 negative results and wrongly gives 10 positive results (false positive). Now, we got P(E|-H), which is 0.1 (another way of saying 10%).
We still need two more terms to complete the calculations – P(H) and P(-H). P(H) is the general chance for Sophie to have Breast Cancer. That is a strange ask! How will she ever know that? Well, national statistics come in handy. Find out the average chance for a 42-year-old woman in the US to have breast cancer. Researching, Sophie finds from an American Cancer Society document that the probability for 40-year-old US women to have breast cancer is 1.5% (P(H) = 0.015). The last term is easy – the chance of a 40-year-old US woman not having breast cancer: 100 – 1.5 or 98.5 (P(-H) = 0.985).
Some Hope, at Last
Let’s plug in all the terms we collected so far. They are P(E|H) = 0.95, P(E|-H) = 0.1, P(H) = 0.015 and P(-H) = 0.985. The calculations become (0.95 x 0.015) / [( 0.95 x 0.015) + (0.1 x 0.985)]. The answer is 0.126 or 12.6%; not that bad, eh!
What options does Sophie have now?
She is feeling much better now. She now knows the real chance of having breast cancer, which is about 13%. She goes to the testing centre for a second test. She will find her results soon, and she understands how to update her chances; plug in all the numbers as before but with the updated value for P(H), which is 0.126.
[There are numerous explanations of Bayes’ them available online, e.g., the one by Veritasium].

