Science

Covid Stories 3 – The Gold Standard

Testing programs are not about machines but the people behind them.

We get into the calculations straight away. The equations that we made last time are:

\text{Chance of Disease after a +ve result} = \frac{Sensitivity *  Prevalence}{Sensitivity *  Prevalence + (1-Specificity)*(1- Prevalence)} \\ \\ \text{Chance of No Disease after a -ve result} = \frac{Specificity*  (1 - Prevalence)}{Specificity*  (1-Prevalence) + (1-Sensitivity)*Prevalence} \\ \\ \text{Chance of Disease after a -ve result} = \frac{(1- Sensitivity )*  Prevalence}{(1- Sensitivity )*  Prevalence + Specificity*(1 - Prevalence)}

Before we go further, let me show the output of 8 scenarios obtained by varying sensitivity and prevalence.

Case #SensitivitySpecificityPrevalenceChance of
Disease for +ve (%)
Missed
in 10000 tests
10.650.980.00134
20.750.980.001 3.62.5
30.850.980.00141.5
40.950.980.0014.50.5
50.650.980.012436
60.750.980.012725
70.850.980.013015
80.950.980.01325
Chance of Disease for +ve = probability that a person is infected given her test result is positive. Missed in 10000 tests = the number of infected people showing negative results in every 10,000 tests.

Note that I fixed specificity in those calculations. The leading test methods of Covid19, RT-PCR and rapid Antigen are both known to have exceptionally low false-positive rates or specificities of close to 100%.

Now the results.

Before the Spread

It is when the prevalence of the disease was at 0.001 or 0.1%. While it is pretty disheartening to know that 95% of the people who tested positive and isolated did not have the disease, you can argue that it was a small sacrifice one did for society! The scenarios of low prevalence also seem to offer a comparative advantage for carrying out random tests using more expensive higher sensitivity tests. Those are also occasions of extensive quarantine rules for the incoming crowd.

After the Spread

Once the disease has displayed its monstrous feat in the community, the focus must change from prevention to mitigation. The priority of the public health system shifts to providing quality care to the infected people, and the removal of highly infectious people comes next. Devoting more efforts to testing a large population using time-consuming and expensive methods is no more practical for medical staff, who are now required at the patient care. And by now, even the highest accurate test throws more infected people into the population than the least sensitive method when the infection rate was a tenth.

Working Smart

A community spread also rings the time to switch the mode of operation. The problem is massive, and the resources are limited. An ideal situation to intervene and innovate. But first, we need to understand the root cause of the varied sensitivity and estimate the risk of leaving out the false negative.

Reason for Low Sensitivity

The sensitivity of Covid tests is spread all over the place – from 40% to 100%. It is true for RT-PCR, even truer for rapid (antigen) tests. The reasons for an ultimate false-negative test may lie with a lower viral load of the infected person, the improper sample (swab) collection, the poor quality of the kit used, inadequate extraction of the sample at the laboratory, a substandard detector of the instrument, or all of them. You can add them up, but in the end, what matters is the concentration of viral particles in the detection chamber.

Both techniques require a minimum concentration of viral particles in the test solution. Imagine a sample that contains lower than the critical concentration. RT PCR manages this shortfall by amplifying the material in the lab, cycle by cycle, each doubling the count. That defines the cycle threshold (CT) as the number of amplification cycles required for the fluorescent signal to cross the detection threshold.

Suppose the solution requires a million particles per ml of the solution (that appears in front of the fluorescent detector), and you get there by running the cycle 21 times. You get a signal, you confirm positive and report CT = 21. If the concentration at that moment was just 100, you don’t get a response, and you continue the amplification step until you reach CT = 35 (100 x 2(35 – 21) – 2 to the power 14 – is > 1 million). The machine suddenly detects, and you report a positive at CT = 35. However, this process can’t go forever; depending on the protocols, the CT has a cut-off of 35 to 40.

On the other hand, Antigen tests detect the presence of viral protein, and it has no means to amplify the quantity. After all, it is a quick point of care test. A direct comparison with the PCR family does not make much sense, as the two techniques work on different principles. But reports suggest sensitivities of > 90% for antigen tests for CT = 28 and lower. You can spare a thought at the irony that an Antigen test is sensitive to detect the presence of the virus that the PCR machine would have taken 28 rounds of amplification. But that is not the point. If you have the facility to amplify, why not use it.

The Risk of Leaving out the Infected

It is a subject of immense debate. Some scientists argue that the objectives of the testing program should be to detect and isolate the infectious and not every infected. While this makes sense in principle, there is a vital flaw in the argument. There is an underlying assumption that the person with too few counts to detect is always on the right side of the infection timeline – in the post-infectious phase. In reality, the person who got the negative test in a rapid screening can also be in the incubation period and becomes infectious in a few days. They point to the shape of the infection curve, which is skewed to the right, or fewer days to incubate to sizeable viral quantity and more time on the right. Another suggestion is to test more frequently so that the person who missed due to a lower count comes back for the test a day or two later and then caught.

How to Increase Sensitivity

There are a bunch of activities the system can do. The first in the list is to tighten the quality control or prevent all the loss mechanisms from the time of sampling till detection. That is training and procedures. The second is to change the strategy from analytical regime to clinical – from random screening to targetted testing. For example, if the qualified medical professional identifies patients with flu-like symptoms, the probability of catching a high-concentrated sample increases. Once that sample goes to the testing device for the antigen, you either find the suspect (covid) or not (flu), but it was not due to any lack of virus from the swab. If the health practitioner still suspects, she may recommend an RT PCR, but no more a random decision.

In Summary

We are in the middle of a pandemic. The old ways of prevention are no more practical. Covid diagnostics started as a clinical challenge, but somewhere along the journey, that shifted more to analytics. While test-kit manufacturers, laboratories, data scientists and the public are all valuable players to maximise the output, the lead must go back to trained medical professionals. A triage system, based on experiences to identify symptoms and suggested follow up actions, is a strategy worth the effort to stop this deluge of cases.

Further Reading

Interpreting a Covid19 test result: BMJ

Issues affecting results: Exp Rev Mol Dia

False Negative: NEJM

Rapid Tests – Guide for the perplexed: Nature

Real-life clinical sensitivity of SARS-CoV-2 RT-PCR: PLoS One

Diagnostic accuracy of rapid antigen tests: Int J Infect Dis

Rapid tests: Nature

Rethinking Covid-19 Test Sensitivity: NEJM

Cycle Threshold Values: Public Health Ontario

CT Values: APHL

CT Values: Public Health England

Covid Stories 3 – The Gold Standard Read More »

Covid Stories 2 – Predictive Values

We have seen the definitions. We will see their applications in diagnosis. As we have seen, both Sensitivity and Specificity are probabilities, and the diagnostic process’s job is to bring certainty to the presence of a disease from the data. And the tool we use is Bayes’ theorem. So let’s get started.

We tailor the Bayes’ theorem for our screening test. First, the chance of being infected after the person was diagnosed with a positive test. Epidemiologists call it positive predictive value or, in our language, the posterior probability.

Positive Predictive Value (PPV)

P(Inf|+) = \frac{P(+|Inf) P(Inf) }{P(+|Inf) P(Inf) + P(+|NoInf) P(NoInf)}

Looking at the equation carefully, we can see the following.
P(+|Inf) is the true positive or the sensitivity, and P(+|NoInf) is the false positive or (1 – Specificity). It leaves two unknown variables – P(Inf) and P(NoInf). P(Inf) is the prevalence of the disease in the community, and P(NoInf) is 1 – P(Inf).

\text{Updated Chance of Disease} = \frac{Sensitivity *  Prevalence}{Sensitivity *  Prevalence + (1-Specificity)*(1- Prevalence)}

And we’re done! Let’s apply the equation for a person who tested COVID-19 positive as part of a random sampling campaign in a city with a population of 100,000 and 100 ill people. The word random is a valuable description to remember; you will see the reason in a future post. Assume a sensitivity of 85% (yes, for your RT-PCR!) and a specificity of 98%.

Chance of Infection = 0.85 x 0.001 /(0.85 x 0.001 + 0.02 x 0.999) = 0.04. The instrument was of good quality, the health worker was skilled, and the system was honest (three deadly assumptions to make), yet she had only a 4% chance of infection.

Negative Predictive Value (NPV)

Now, quickly jump to the opposite: what is the chance someone who got tested negative, escapes the diagnostic web of the community?

P(NoInf|-) = \frac{P(-|NoInf) P(NoInf) }{P(-|NoInf) P(NoInf) + P(-|Inf) P(Inf)} \\ \\  \text{Updated Chance of No Disease} = \frac{Specificity*  (1 - Prevalence)}{Specificity*  (1-Prevalence) + (1-Sensitivity)*Prevalence} \\ \\  = \frac{0.98 * 0.999}{0.98 * 0.999 + 0.15 * 0.001} = 0.9998

There is a 99.98% certainty of no illness or a 0.02% chance of accidentally escaping the realm of the health protocol.

What These Mean

In the first example (PPV), a 4% chance of infection means relief to the person eventually, but there is a pain to do the mandatory ‘insolation’ as the system treats her as an infected.

The second one (NPV) is the opposite; for the individual, 0.02% is low; therefore, a test with medium sensitivity is quite acceptable. For the system, which wants to trace and isolate every single infected person, this means, that for every 10,000 people sampled randomly, there is a chance to send out two infected individuals into the society.

We have made a set of assumptions regarding sensitivity, specificity and prevalence. And the output is related to those. We will discuss the reasons behind these assumptions, the cost-risk-value tradeoffs, and the tricks to manage traps of diagnostics. But next time. Ciao.

Bayes’ rule in diagnosis: PubMed

False Negative Tests: Interactive graph NEJM

Covid Stories 2 – Predictive Values Read More »

Covid Stories 1 – Know the Jargons

Screening tests such as PCR are typically employed to test the likelihood of microbial pathogens in the body. Test results are estimates of probability and are evaluated by trained medical professionals to confirm the illness or to recommend any follow-up actions. Two terms that we have extensively used in the last two years have been the sensitivity and specificity of covid tests.

Sensitivity: Positive Among Infected, P(+|Inf)

Sensitivity is a conditional probability. It is not the ability of the machine to pick ill people from the population, although it could be related. But it is:

  • A test’s ability to correctly identify from a group of people who are infected.
  • P(+|Inf) – the probability of getting a positive result given the person was infected.

\text{Sensitivity} = \frac{\text{Number of true positives (TP)}}{\text {Number of true positives (TP) + Number of false negatives (FN)}}

A test has a sensitivity of 0.8 (80%) if it can correctly identify 80% of people who have the disease. However, it wrongly assigns 20% with negative results.

Specificity: Negative Among Healthy, P(-|NoInf)

  • A test’s ability to correctly identify from a group of people who are not infected.
  • P(-|NoInf) – the probability of getting a negative result given the person was not infected.

\text{Specificity } = \frac{\text{Number of true negatives (TN)}}{\text {Number of true negatives  (TN) + Number of false positives (FP)}}

A test with 90% specificity correctly identifies 90% of the healthy and wrongly gives out positive results to the rest 10%.

Final Remarks

We’ll stop here but will continue in another post.
Sensitivity = P(+|Inf) = 1 – P(-|Inf). If you are infected, a test can either give a positive or a negative result (mutually exclusive probabilities). In other words, you are either true positive or false negative.

Specificity = P(-|NoInf) = 1 – P(+|NoInf). If you are healthy, a test can either give a negative or a positive test result – a true negative or a false positive.

Does a positive result from the screening test prove the person is infected? No, you need to know the prevalence to proceed further. We’ll see why we developed these equations and how we could use them to evaluate test results correctly.

Sensitivity and Specificity: BMJ

Covid Stories 1 – Know the Jargons Read More »

Vaccine Kinetics – What Chemist Sees

Let me start with a disclaimer: this is purely for demonstration purposes. The numbers used in the following analysis should not be viewed as an accurate description of the complex biological processes in the body.

In an earlier post explaining vaccination, I had mentioned the law of mass action. It is also called chemical kinetics. For a chemist, everything is a reaction, and solving kinetic equations are the way of understanding the world around her.

Equations of life

Molecules react to form products. Consider the following hypothetical reactions.

(1)   \begin{equation*}  \begin{aligned} V\xrightarrow{\text{k1}}2V \\  \end{aligned} \end{equation*}

(2)   \begin{equation*}  \begin{aligned} P\xrightarrow{\text{k2}}A \\  \end{aligned} \end{equation*}

(3)   \begin{equation*}  \begin{aligned} V + C \xrightarrow{\text{k3}} cell death \\  \end{aligned} \end{equation*}

(4)   \begin{equation*}  \begin{aligned} A + V\xrightarrow{\text{k4}} precipitate   \end{aligned} \end{equation*}

V represents virus, A for antibody, C for cells and P for blood plasma.

As per the law of mass action, the speed of a reaction is related to its rate constant and concentrations of ingredients. The four items above translate to a set of differential equations,

(5)   \begin{equation*}  \begin{aligned} \frac{dC_V} {dt} = 2 k1 C_V - k3 C_V C_C - k4 C_A C_V \\  \end{aligned} \end{equation*}

(6)   \begin{equation*}  \begin{aligned} \frac{dC_A} {dt} = k2 - k4 C_A C_V \\  \end{aligned} \end{equation*}

(7)   \begin{equation*}  \begin{aligned} \frac{dC_C} {dt} = - k3  C_V  C_C \\  \end{aligned} \end{equation*}

What do these equations mean?

  • All three equations have a rate (speed) term on the left and a set of additions (production) and subtractions (consumption) on the right. 
  • The speed of each reaction is related to the concentrations of the constituents.
  • If a reaction rate constant increases, the speed of the reaction increases.
  • The production rate of antibodies (from blood plasma) is assumed constant.

Let us solve these three differential equations simultaneously. I used the R package ‘deSolve’ to carry out that job.

Case 1: A person in a risky group and no vaccination

Used the following set of (arbitrary) numbers: k1 = 0.45, k2 = 0.05, k3 = 0.01, k4 = 0.01. Intial concentrations (time = 0) Ca = 0, Cc = 100, Cv = 1.

You can see that the person is in real danger as all her cells have been attacked by the virus that multiplied exponentially.

Case 2: A person with healthy antibody production and no vaccination

Now, use exactly the same input, but the antibody production rate constant k2 is 4 x: k1 = 0.45, k2 = 0.2, k3 = 0.01, k4 = 0.01.

The initial growth of the virus was curbed down pretty fast by the antibodies and the person survived.

Case 3: Risky group and vaccination

The parameters are the same as in case 1, but 5 units of antibodies are available at time zero (from vaccination).

Case 4: Risky group, vaccination, double viral load

Same as case 3, but the initial viral concentration doubled – from 1 to 2.

Case 5: Risky group, booster vaccination, double viral load

Same as case 4, but the antibodies from vaccination was double, or at ten units.

Case 6: No vaccination and double viral load

This case was created to show the speed at which the virus took control over the body. The parameters are exactly the same as case 1, but the initial virus load increased to 2 from 1.

In summary

These are simplistic ways of picturing what dynamics are going on in our body once a virus comes in. Treatments (mathematical) like these can also expand our imagination to newer ways of managing the illness. Say, can we find a way to reduce the rate constant k1 (viral replication)? Antiviral drugs such as ‘molnupiravir’ are expected to do precisely this.

Mechanism of molnupiravir-induced SARS-CoV-2 mutagenesis: Nature

Vaccine Kinetics – What Chemist Sees Read More »

Vaccine Debate and The Notion of Cheating

I was not originally planning to write this piece here. It just happened as an immune response to a fast-spreading youtube virus.

What is the debate?

The argument of the youtube virus was: vaccines protect from illness. It is well-known that the current vaccines are not stopping the disease from spreading. The current vaccines only manage the condition from becoming worse. Therefore, they are not vaccines, and the system is cheating people”. He also uses a fallacy called the appeal to authority and invokes high-profile personalities from the Indian Council of Medical Research to support his view (I didn’t think a fact-check was necessary; evidence should lead and not personalities).

The vaccinated are getting infected!

I have made two posts already to show using data that the current vaccines are just delivering as they promised. Also proved mathematically, the reason for the large number of breakthrough infections for Covid, while there are near-zero levels for those vaccinated against traditional illnesses. Some of the old vaccines appear so good because their prevalence is negligible these days. Once you view the present-day covid vaccines in that light (of super high prevalence in society), you appreciate the work they are doing.

Infection vs Disease

Infection happens when pathogens (bacteria, viruses, others) enter the body and multiply. So what can prevent an infection? A barrier around your nose and mouth or by staying at home! On the other hand, disease occurs when the infection begins damaging cells. The signs of symptoms appear, and the body’s immune system acts. It is worth noting that many of the symptoms result from the activities of the immune system; fever is a well-known one.

Prevention vs Mitigation

These are two terms typically used in risk management. Their definitions are below (taken from OALD).

Prevention: the act of stopping something bad from happening. Mitigation: a reduction in how unpleasant, serious, etc. something is.

It is easy for humans to jump into the binary of prevention vs mitigation, or vaccine vs medicine. But life is more than such binaries and is full of things in between. Say the risk of getting a stroke. Doing exercises, eating balanced food, and leading a healthy lifestyle are considered prevention strategies. Suppose you have high blood pressure and you take medicines to control it. You may call it mitigation to the condition called high blood pressure. Or it can also be prevention for the real issue, the chance of getting a stroke or a heart attack or a kidney failure. In other words, prevention vs mitigation becomes a philosophical debate.

A boost to immunity?

The most useless definition of how vaccines work is boosting immunity. As a scientist, you want better. What about this: vaccines trigger immunise response in the body? It sounds better, but what is that?

When pathogens enter the body, they attach to the cell and use their resources to multiply. While all the cohabitant microbes do these (the human body has more microbes than the number of cells), only a few guys are called pathogens for a reason. They spit out antigens that can cause harm to the cell. The body uses a few techniques to mitigate this. Yes, ‘mitigate’ is my word of choice, from the viewpoint of the antigen, but you may use ‘prevent’ from the cell’s point of view. The body may respond with fever (heat inactivates many viruses), a chemical called interferon (which blocks viruses from reproducing), or deploy antibodies and other cells to target the invader.

How do Covid vaccines work?

Most of the Covid vaccines are targetting the production of antibodies against spike proteins. The antibodies, produced by the body, connect to the anchor points of the virus (the spikes), nullify the attachment of the latter, and eventually its proliferation.

One thing is clear: you need to somehow get antibodies to where it is required. Many new-generation covid vaccines work by transferring the genetic information – that produces the protein-spike – to our cells, either through messenger RNAs or by inserting it inside other viruses. Once the body gets the code, it starts making spike proteins, and antibodies follow.

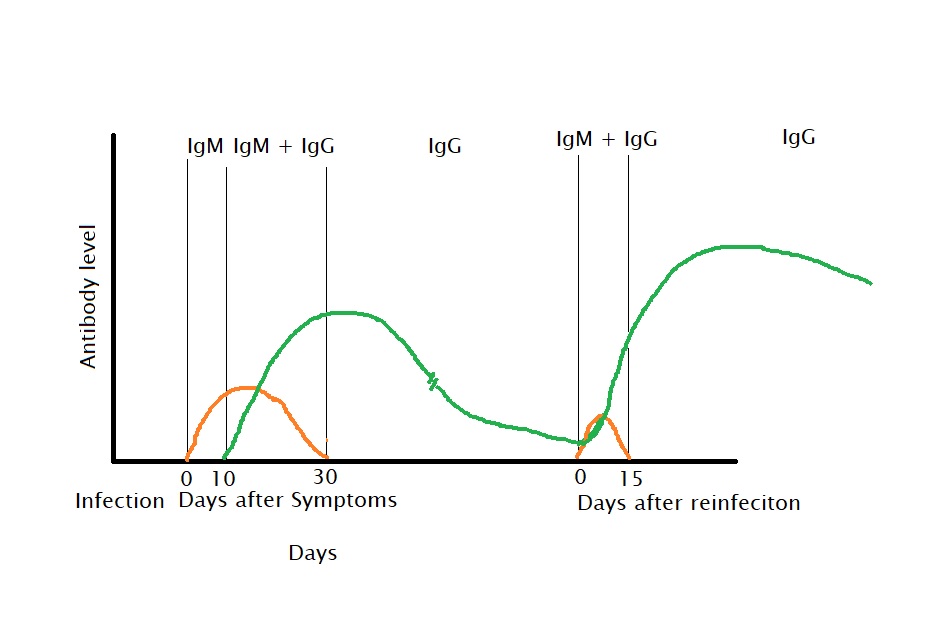
Infection and Reinfection Curves

A simple schematic of antibody production. The numbers are indicative and may vary from person to person or from disease to disease.

Several publications are available that quantify antibodies produced from various covid vaccines. To give a personal touch, the following are data from my blood tests, taken at three different intervals after my vaccine jabs.

Test done in July 2021
Test Done in August 2021
Test done in November 2021

Laws of mass action – What makes the debate possible?

The reaction rate between A and B forming a product is proportional to their concentrations and rate constant. The higher the concentrations or the rate constant, the faster is the reaction. Any standard chemistry textbooks will give you details. Four reactions are important to consider – the first two are against us, and the last two are with us. 1) virus + resources -> 2 virus, 2) virus + cell -> destruction. 3) blood plasma -> antibodies 4) virus + antibody -> safe product. We want items 3 and 4 to happen faster than 1 and 2.

Suppose an individual gets exposed to a high viral load. It makes the virus concentration of reactions 1 & 2 high and forces the reactions to go faster. The reaction that matters the most, reaction-4, will take some time as the amount of antibody, in the beginning, is zero. If the first reactions manage to destroy more cells, you are in big trouble. This is the trouble with Covid19; it multiplies faster and has a high sticking tendency due to its spikes.

What is the end goal of the debate?

The virus is ubiquitous now that you can see all possible ways it demonstrates in public – from people who get up without any symptoms to people dying even after getting multiple doses of vaccines. We are talking about hundreds of millions of bodies carrying out these reactions in real time. Whenever that happened in the past, they took millions of life along with them.

You will never know the real goal of the debate, but I can tell you the result. It is confusion, mistrust in the system and ultimately vaccine hesitancy. These are proving, once again, that it is easy to confuse people, by using well-known facts, but by taking them out of context and making a louder noise.

Is it prevention or mitigation? The question is not valid, and it is not either-or. Prevention and mitigation are just viewpoints that we might get based on your body’s performance. These vaccines are like any other vaccine; their job is to provide scenarios of the first infection, and are our best weapon to fight the disease, so get it. There are hundreds of data, not opinions, available in public space that support this. The only difference this time? The lab work is happening in front of you, with spotlights on!

Further Read

Safety and immunogenicity of the ChAdOx1 nCoV-19 vaccine: The Lancet

ChAdOx1 nCoV-19 vaccine: The Lancet

Why do only some infect us? National Geographic

Antibody response in covid patients: Nature Scientific Reports

How do vaccines work? WHO

Chemical Kinetics: Wiki Page

Antibody Tests: clinisciences.com

How Infection Works: NCBI

Measurement of Antibodies: J Clinical Microbiology

Types of COVID-19 vaccines: Mayo Clinic

IgG antibody to SARS-CoV-2: BDJ

Vaccine Debate and The Notion of Cheating Read More »

The population of South Asia

Mixing is the reality of life; pure only exists in our imagination.

Humans have this love for purity and feel shame about the undeniable reality of mixing. While people in some parts of the world are proud of eating a ‘purely’ vegetarian diet, others list everything they could recollect from their harddisks to proclaim their superior ancestry. They are all right, but only for a negligibly short duration in history. Human history does not give a damn about vegetable eaters, and the same for any exclusive ancestry!

A landmark research paper came out in September 2019 in the journal Science titled, ‘The formation of human populations in South and Central Asia’. It was a report based on ancient DNA data from 523 individuals spanning the last 8000 years, from Central Asia and northernmost South Asia.

Migration of Yamnaya Steppe Pastoralists

The paper was primarily on the migration of the Eurasian Steppe to South Asia around 3000 years ago. The ‘Steppe Ancentry’ or Yamnaya culture was active around 5000 years ago in present-day Ukraine and Russia. The folks from that region had travelled to either side of the world, to Europe and South Asia. Today we talk about the guys and, perhaps some girls, who migrated to the east.

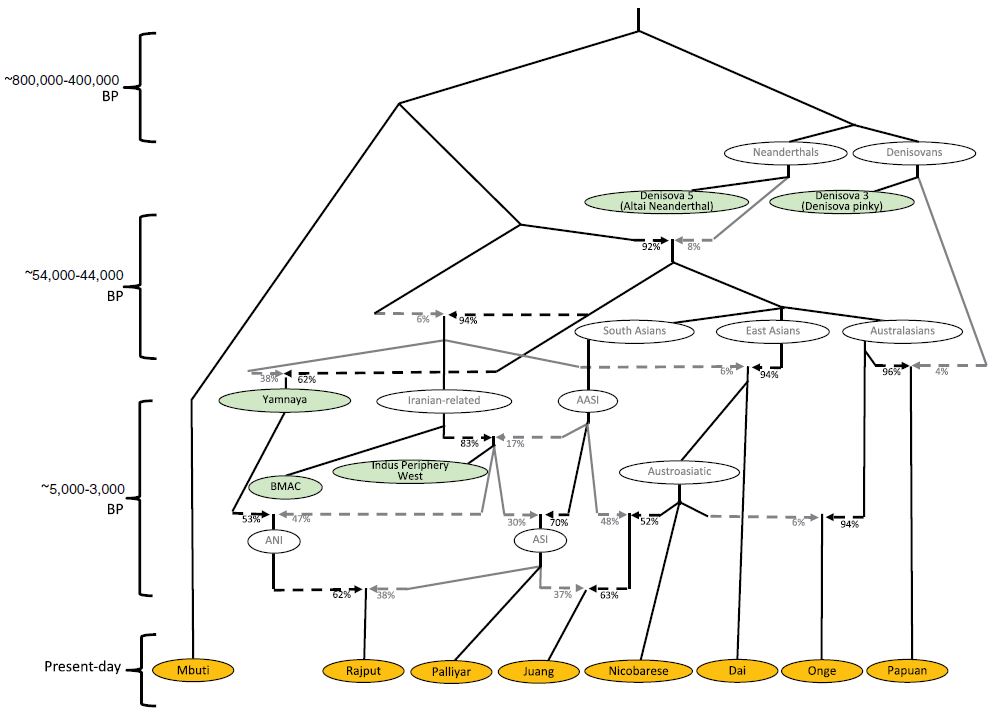
It is relevant here to talk about another DNA study published in Nature in 2009. This study genotyped 125 DNA samples of 25 different groups of India and did what is known as a Principal Component Analysis (PCA) of the data. Based on the similarities of the allele, they found a relationship between people of the North and South of India. An ancestral component, they call it ANI (Ancestral North Indian), varied from 76% for the North to 40% in the south. The remaining fraction is the ASI (Ancestral South Indians). Note that a ‘Pure’ ASI, closer to the earliest humans (travelled from Africa, of course), was not seen in that study.

Where are those people? That is next

Flashback

ASI was ‘ruling the land’ and Indus Valley Civilisation (IVC) was flourishing when the Steppe folks arrived in present-day India. But that would change soon, and the visitors would form a mix, which is the base of the continuous band from North to South that we saw earlier. So was ASI was the original one? The answer is a firm NO. ASI was a mix of what is known as AASI and a group of people with Iranian farmer ancestry. And who were this AASI? Well, they were the people who came 40,000 years ago, yes, from the cradle of homo sapiens, Africa. Of course, the Iranian farmers also went from Africa, but a few tens of thousands of years earlier.

Piecing All Together

The following picture, copied from the Science paper, summarises the whole story.

Why Is It Important?

It is always fun to learn more and more about the incredible spread of homo sapiens from Africa to the rest of the world. It is equally wonderful to note how dynamic was the intermixing of population. Also, notice one irony. These results, the vivid stratification of ANI and ASI, were possible due to their obsession with endogamy in the last few hundred years. That way, they preserved the signatures of the founders or else it would have been a complete mixing of genes.

The formation of human populations in South and Central Asia: Science

Reconstructing Indian population history: Nature

The population of South Asia Read More »

Probabilities and Evolution

What is the probability of creating a fully developed animal or a human being? Creationists often use this argument to challenge science, but that is understandable. What is depressing is to see many scientists, too, falling into their trap.

Look at this mind-boggling probability. Think about one biological molecule in our body – haemoglobin. The molecule consists of 4 chains of amino acids, and each chain is about 146 links consisting of a possible 20 amino acids. So, to get a functional molecule, it needs to get one right out of (20)146 options. How is it then possible to have the whole human body created? Since your random processes can’t explain such ‘beautiful crafts’ of nature, you better accept my design theory!

It is a valid question, except that today’s complex systems are not formed like this. The answer lies in evolution. You and I are today because of the accumulated small changes. Not from any single change. Getting a small change is relatively easy, with about a few million unforced errors happening every day.

The complex systems we see today all originated from simpler systems. And those simpler ones, from even simpler ancestors. Until the stage, when the first life, some RNA-based self-replicating molecule, was formed! And how are they made? By chance in the chemistry laboratory of the earth using simple gases in the presence of heating, cooling and lightning. Stanley Lloyd Miller and Harold Clayton Urey proved that in 1953 by using methane, ammonia, water, hydrogen, and electric discharge to produce amino acids. Subsequent works of scientists synthesised the building bases of RNA from simple molecules.

In my post on SLC24A5 or the one on plant breeding, we have seen that a simple change in a random gene location can produce wonders. Think about it. There have been 3.5 billion years passed since the first life. Millions of trivial changes happened, a few of them passed through the sieves of nature, and a number of them got rejected to extinction. It is called natural selection.

Richard Dawkins: The Blind Watchmaker

Blind Watch Maker

Stanley L Miller, A production of Amino Acids Under Possible Primitive Earth Conditions, Science, 1953

Formation of nucleobases in a Miller–Urey reducing atmosphere, PNAS, 2017

Probabilities and Evolution Read More »

Eating Natural and Other Lies

Most of the food you eat today is genetically modified, if not all! By genetic modification, I do not mean that the cultivar had gone through countless Petri dishes and a bunch of scientists injected solutions that would consciously and systematically modify specific parts of its DNA. Much milder than that, through a process called plant breeding, a fundamental process in agriculture.

Let me go a step further: humans cannot (or would not) make the transition from the Hunter-Gatherer society to the Agrarian without violating the rules of natural selection. We have seen Natural Selection before, and I want to repeat: Nature does not select anything. Nature only offers its playground and let the living species play random games. Some survive the game; we only get to see the survivors.

Humble Story of Staple Grains

Take wheat, rice and corn, which satisfy more than 50% of the calory requirements of the world. They all had their beginnings as grasses that bore too small seeds to attract any animals. Wild wheat seeds grew at the top of a stalk that spontaneously shattered and spread as far as possible, away from public sight, and quietly germinated. For that reason, they escaped early humans until a single-gene mutation caused a few plants to lose the capacity to shatter. For the wheat plant, this would be detrimental for the seeds cant fly to places and germinate. By the way, if I made you think that the plant was doing all these out of intelligence, let me rephrase – plants with such a defect won’t survive for long because of their limited capacity to spread their offspring.

However, such useless mutants were a lottery for humans as they got control of the entire growth and regrowth of the plants without losing any seeds. Wheat is now in her orchard. Occasionally, the already ‘unnatural’ plant gets another mutation, yielding larger seeds. From the plant’s viewpoint, what happened is a sheer wastage of its nutrients; after all, a seed, irrespective of its size, gets a single chance to become the next plant. Humans, on the other hand, love it and select only those bigger ones and grow.

For centuries we did this process without knowing what we were doing. Now we know the details, so much so that we know what parts of its genetic make-up need to change. And we also know how to change it!

Guns, Germs, and Steel by Jared Diamond

Eating Natural and Other Lies Read More »

Down Syndrome Continued

How odds and percentages can sometimes hide the big picture away from our eyes was the topic of an earlier post on Down Syndrome. Today, we continue from where we left off.

The data we analysed were livebirth from 10 states in the united states. That approach has a few issues. First, it included only 10 out of the 50 states. Second, and perhaps more importantly, the data covered only live births. In other words, there could be a survivorship bias to the data. What if children born with Down syndrome from different age-group-mothers have different chances of survival? Can it turn our analyses and insights upside down? Well, we don’t know, but we will find out.

Updated Data Including Stillbirths

Last time we sampled 10 states, 5600 live births and a total of 4.4 million mothers. Here we widen our net to cover 29 states, 12,946 births (live births and stillbirths) and a population of 9.8 million mothers. The messages are:

Women above 40 risk about 12 times higher than those younger than 35 to have babies with Down Syndrome. Yet, 54% of the mothers were 35 years or younger.

Not Done Yet

Is this all before we claim a logically consistent analysis? The answer is an emphatic NO. We still miss a major confounding factor that can potentially lead to a survivorship bias. It is the increased use of prenatal testing and termination of pregnancy for women older than 35. What we see at the end could be biased statistics of the probability distribution. So, the work is not done yet, and we will do more research in another post.

Selected Birth Defects Data from Population-Based Birth Defects Surveillance Programs in the United States, 2006 to 2010

Epidemiology Visualized: The Prosecutor’s Fallacy

Down Syndrome Continued Read More »

Swiss Cheese against Covid

The COVID-19 pandemic presented us with a live demonstration of science at work, much to the surprise of many who are not regular followers of its history. It gave a ringside view of the current state of the art, yet it created confusion among people whenever they missed consistency in the messaging, theories, or guidelines. The guidance on protective barriers—using masks, safe distancing, and hand washing—was one of them.

Swiss Cheese Model of Safety

The Swiss cheese model provides a picture of how the layered approach of risk management works against hazards. Let us use the model to check the underlying math behind general health advice on COVID-19 protection. I describe it through a simplified probability model.

The probability of someone getting infected by Covid 19 is a joint probability of several independent events. They are the probabilities:

  • an infected person who can transmit the virus in the vicinity (I)
  • to get inside a certain distance (D)
  • to pass through a mask (M)
  • to pass through the protection due to vaccination (V)
  • to get the infection after washing hands (H)
  • to infect the person once the virus is inside the body (S)

Infected person in the vicinity (I): is equal to the prevalence of the disease (assuming homogeneous mixing of people). Let’s make a simple estimate. These days, the UK reports about 50,000 cases per day in a population of 62 million. It is equivalent to an incident rate of 0.000806. Assume that an infected person can transmit the virus for ten days, and half of them manage to isolate themselves without passing the virus to others. The prevalence (proportion of people who can transmit the disease at a given moment) is 5 x 0.000806 = 0.0004032. Multiply by a factor of 2 to include the asymptomatic and the symptomatic but untested folks too into the mix. Prevalence becomes = 0.0008064 (8 in 1000).

To get inside a certain distance (D): If the person managed to stay outside the 2 m radius from an infected person, there could be zero probability of getting infected, but it is not practically possible to follow every time. Therefore, we assume she managed to stay away 50% of the time, which means a probability of 0.5 to get infected.

To pass through a mask (M): General purpose masks never offer 100% protection against viruses. So, assume 0.5 or 50% protection.

To pass through the protection from vaccination (V): The published data suggest that vaccination could prevent up to 80% of symptomatic infections. That means the chance of getting infected is 0.2 for the vaccinated.

The last two items – hand washing (H) and susceptibility to getting infected (S) – are assumed to play no role in protecting COVID-19. Infection via touching surfaces plays a minor role in transmission, and the latest variants (e.g. Delta) are so virulent that almost all get it once it is inside the body.

Scenario 1: Fully Protected Getting Infected Outdoor

Assume a person makes one visit outside in a day. The probability of getting the infection is = I x D x M x V x H x S = 0.008 x 0.5 x 0.5 x 0.2 x 1 x 1 = 0.0004 or the chance of not getting is 0.9996.

The person makes one visit for 30 days (or two visits for 15 days!). Her probability of getting infected on one of those days is = 1 – the probability she survived for 30 days. To estimate the survival probability, you need to use the binomial theorem. Which is 30C30 x 0.999630 x 0.0040 = 0.988. The chance of a fully protected person getting infected in a month outdoors is 1 – 0.988 or 12 in 1000!

Scenario 2: Fully Protected Person Indoor

The distance rule doesn’t work anymore, as the suspected droplets (or aerosols or whatever) are available everywhere. The probability of getting the infection is = I x D x M x V = 0.008 x 1 x 0.5 x 0.2 = 0.0008. This means the chance of not getting is 0.9992. 30-day chance is 1 – 0.976 = 0.024 or 24 in thousand.

Scenario3: Indoor Unprotected but Vaccinated

I x I x D x M x V = 0.008 x 1 x 1 x 0.2 = 0.0016. The chance of getting infected in a month = 1 – 0.95 or 5 in hundred.

Scenario4: Indoor Unprotected

I x D x M x V = 0.008 x 1 x 1 x 1 = 0.008. The chance of getting infected in a month = 1 – 0.78 or about 2 in 10 chance.

A bunch of simplifications were made in these calculations. One of them is the complete independence of items, which may not always hold. Some of these can be associated – a person who cares to make a safe distance may be more likely to wear a mask and get vaccinated. Inverse associations are also possible – a vaccinated person may start getting into crowds more often and stop following other safety practices. 

Second is the simplification of one outing and one encounter with an ill person. In reality, you may come across more than one infected. In the case of indoor, the suspended droplets containing the virus act as encounters with multiple individuals.

The case of health workers is different as the chances of encountering an infected person in a clinic or a medical facility differ from that in the general public. If one in ten people who come to a COVID clinic is infected, the chances of the health worker getting infected in a month are 95% if she wears an ordinary mask and comes across 100 patients daily. If she uses a better face cover that offers ten times more protection, the chance becomes about 25% in a month, or one in 4 gets infected even after getting vaccinated.

Bottomline

Despite all these barriers, people will still get infected. Small portions of large numbers are still sizeable numbers but do not get distracted by them. Use every single protection that is available to you. Those include vaccination, mask use, maintaining distance, and reducing non-essential outdoor trips. They all help to reduce the overall rate of infection.

Swiss Cheese against Covid Read More »