Data & Statistics

The New Study Reveals That

WebMD ran an article in 2008 titled Eating Breakfast May Beat Teen Obesity. The article caused quite a stir in the public domain. The original study, published in Pediatrics, focused on the dietary and weight patterns of 2,216 teenagers over five years (1998-2003) from public schools in Minneapolis-St. Paul, Minnesota. 

Did the study conclude that breakfast is a medicine for teenagers to fight against obesity? At least the title and the opening remarks gave that impression. Before jumping to a conclusion, let us examine the various possibilities.

Cause or a Coincidence?

The first possibility is that it could be a complete coincidence that those who ate breakfast gained less weight. That is an easy remark that one can pass to any such study.

What Other Reasons?

Think about possibilities that can make someone skip breakfast. Maybe she wakes up late and has no time to breakfast before school. This could be because she sleeps long or goes to bed late. What about the eating habits of people who sleep late at night? The late sleepers may pack their meal with more or multiple sets of food.

What about some of them skipping breakfast because they were already obese (for any other reasons) and wished to cut some calories (cause and outcome reversed)?

How important are the study location, socioeconomic background, and education levels? As per the CDC, even in the US, obesity is lower among people with lower and higher income but higher in middle-income groups. What could be the outcome had the research been conducted in India, Australia, The Netherlands, or the Republic of Congo?

Or Just a Correlation?

Would the conclusions have differed if the researchers had examined their lunch, dinner, or snack habits? WebMD leaves some clues.

“A new study shows teenagers who eat breakfast regularly eat a healthier diet and are more physically active throughout their adolescence than those who skip breakfast”.

So it is not just eating breakfast, but a set of other things, or confounding factors, are also important. The first word to notice is regularly, which suggests certain habits. The second one is more physically active, and the third is a healthier diet, which may include more fibre and less fat. We know cutting excessive fat consumption and regular exercise leads to weight loss.

There are many possible explanations to explain this correlation other than a simplistic statement for weight loss. In statistics, these are confounding variables, which happen when a common cause gives out multiple results, leading to the confusion that one of the outcomes is caused by the other.

WebMD Article

Adult Obesity: CDC

The New Study Reveals That Read More »

Gambling on a Roulette Wheel

It is critical to decide on the objective of visiting a casino – for fun or to make money. If it’s for fun, you can stop reading this post, go to a casino, and have fun. If it’s for making money, the rest of the post is for you.

Gambling is a business whose objective is to make money – pay off the cost of operations and make some profit. Therefore, it is structured to keep the overall odds in its favour. Since it doesn’t care about the individuals in the process, gamblers have opportunities to have fun, get some money if lucky, etc.

Look at the math and business of the Roulette game:
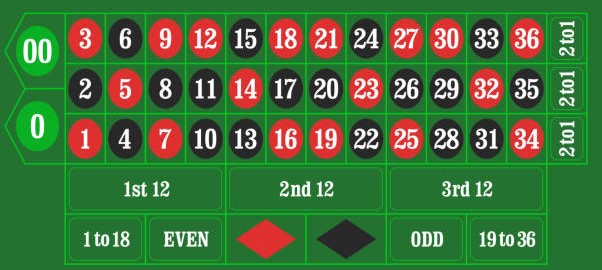
There are multiple types of bets one can make, and one of them is red-black. You bet 1 dollar on a red; if you get a red, you make a dollar; if black, you lose your money.

Look at the above picture. There are 18 reds in a total of 38 numbers, and your chance to get a red is 18 in 38 (or 18/38). The chance you lose your 1 dollar is 20 in 38 (20/38).

Overall expected profit for you is equal to:
chances of your win x prize you win – chances of your loss x price you lose = (18/38)x(1) – (20/38)x(1) = – 0.0526.

About 5.3 cents per 1 dollar goes to the casino, which is their profit.

Now you change the betting type and say the first 12 for a dozen. In this bet, you will get 2 dollars for every dollar. Your chance of getting in the first 12 is 12/38; for not getting, it is 26/38. If you work out the math, you will get (12/38)x(2) – (26/38)x(1) = – 0.0526.

Take another type that is betting on a single number (straight up). The prize for a win is 35 dollars for every dollar. And the expected returns? (1/38)x(35) – (37/38)x(1). No marks for guessing: 5.3 cents per 1 dollar goes to the casino!

Does that tell you that you will never make money in gambling? You may make money sometimes, and that is where your purpose of visiting makes the difference. If your goal is to make money, you have a problem, as the game is designed for the casino to make money. Or the odds are stacked against you. It is okay if it is for pure fun, as any luck you may get becomes a bonus. It also means that the longer you play, the higher the chance of you losing money as you slowly regress to the mean. The same is true if you place multiple bets simultaneously; it accelerates your chances of reaching the mean, which is biased against you. Since the game never stops, the casino will manage to match their odds in the end.

Gambling on a Roulette Wheel Read More »

Why Do ‘So Many’ Vaccinated Get Infected?

A news item broke out in October 2021 on the vaccination program in Kerala (India). The journalist on screen was ‘shocked’ at the daily report of 6525 vaccinated and 2802 unvaccinated in the group of 9327 infected adults. Infection numbers among the vaccinated people outnumbered the unvaccinated. And it raised serious doubts over how the state managed the vaccination program.

Let’s try and understand what these numbers mean.

Infection Risks

The number of adults infected in the vaccinated: 6525
The total vaccinated adults in Kerala (at least one dose): 25.01 million
Infection risk for the vaccinated: (6525 / 25,010,000)x100 = 0.026%

The number of infected adults in the unvaccinated: 2802
The number of unvaccinated adults on that date: 1.68 million
Infection risk for the unvaccinated: (2802 / 1,680,000)x100 = 0.167%

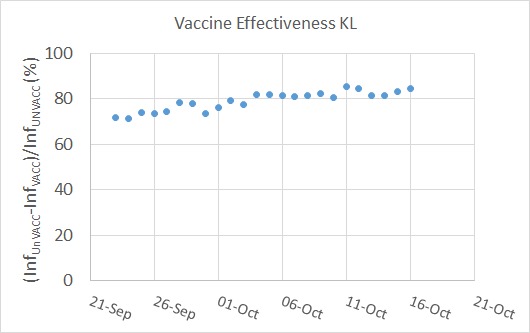
Vaccine effectiveness: (difference in infection risk between unvaccinated and the vaccinated) / infection risk of the unvaccinated = (0.167-0.026)/0.167 = 84%, not bad, heh?

We can repeat the exercise for a month to get a statistical perspective. Here is what I get

I did not use the word efficacy to describe my results, though I used the math behind that calculation. Estimating vaccine efficacies requires a more careful analysis of the infection data, something I leave to the experts in the field. What I did here is a preliminary assessment to make sense of the journalist. And the analysis suggested that the vaccine did what it promised.

Remember our theme?: life is about chances, rationality, and decision-making.

[1] The math of vaccine efficacy; NYT article

[2] Link to Kerala Covid Dashboard

Why Do ‘So Many’ Vaccinated Get Infected? Read More »

To Be or Not to Be: for a Decarbonised World

“That is the question.
Whether ’tis easier to ignore and suffer
The heat and cold of unpredictable future
Or to put life and money against the unwavering force,
And make a chance for my past to redeem?”

a poor adaptation of Shakespeare’s Hamlet

What is decarbonisation?

Decarbonisation is the process of reducing human-made greenhouse gas (GHG) emissions. Based on scientific evidence, there are a bunch of gases in the atmosphere that can cause what is known as global warming. Out of these gases – carbon dioxide (CO2), methane (CH4) and nitrous oxide (N2O) – CO2 accounts for more than two-thirds.

Why do we need to change?

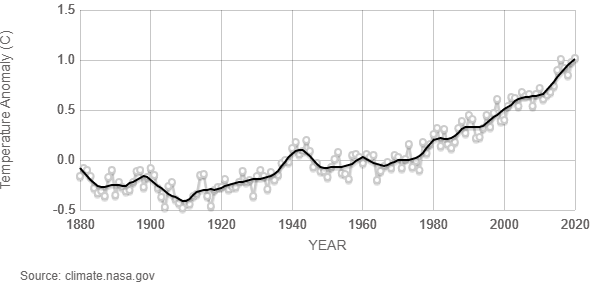
Global warming, or the steady increase of mean global temperature, is well established and has been very dramatic since the early last century. GHG plays a pivotal role in warming and the associated changes in weather patterns (known as climate change). It is well-established by observations and through various climate models. The plot below shows the mean change in global temperature since 1880 (taken from NASA’s Global Climate Change page).

As per ClimateWatch, human activities are responsible for about 47 billion tonnes of CO2 equivalent in 2018, and 34 billion (73%) of it is from the energy sector. The remainder is predominantly agriculture and land usage.

Who can make a difference?

While the world needs to unite to manage GHG emissions, three sectors in the energy bucket hold the key to success. The top three sectors that account for approximately 80% of the energy consumers are industry (29% or 120 million TeraJoules), transportation (29%) and residential (21%) (based on 2019 data from the International Energy Agency (IEA)). Carbon-based fuels (oil, gas and coal) supply 80% of this energy.

How can we change?

There are a few options ready in the development funnel. The first one is using electricity as the primary vehicle for energy supply. And the electricity may come from renewables (wind, solar, hydro, geothermal), nuclear, and even carbon-based fuel with carbon capture and storage. The last option may work during transition, with a systematic plan to move away. Wherever storage is required, batteries and hydrogen (produced from water and electricity) come in handy.

What are the challenges? 

The first one that comes to mind is cost, especially for the industrial and transportation sectors. The fundamental driver for it to change is when the replacement’s total cost (capital and operation) is lower than the operating cost of the existing technology. Costs usually come down when there is production on a sufficient scale. However, here is a chicken and egg problem – higher costs prohibit the scale, and costs can not come down when the scales are low; it is the right time for the government to intervene through mandates and incentives.

Then comes infrastructure and affordability for electrification; both affect the transportation sector. The easy part is to produce electricity, followed by storage. Batteries help smaller vehicles but not the larger ones – the trucks, ships and aircraft. So, you require a different solution. The transformation of smaller vehicles also has its challenges. How will you provide incentives to a billion pieces of equipment spread all over the planet – be it charging points or simply the financial means to procure an electric vehicle?

The last sector is residential. You may think it was the easiest to change based on the public outcry to stop global warming. I will argue that it is the most difficult to change. First, like the case with cars, buildings are spread all over the world. Unlike automobiles, they are more expensive to change and even more difficult to convince that part of the problem is just in my backyard.

Further Reading

[1] Global trends temperature: NASA Page

[2] Energy Supply and Production: IEA

[3] GHG Emissions: ClimateWatch

[4] What three degrees of global warming look like: The Economist

To Be or Not to Be: for a Decarbonised World Read More »

Judgement of Risks and Decision Making

In the long run, we are all dead” John Maynard Keynes 

Rewind your memories to August of last year (2020). The Oxford group have just published a landmark report, ChAdOx1 nCoV-19 vaccine against SARS-CoV-2 (20th July in Lancet). For the planet that was reeling under Covid 19, it was a rare piece of good news.

Vaccines and Side Effects

Fast-forward a year, and the world has a few more candidates, and everyone expects vaccination to start in full steam. But the excitement has partly given way to confusion and scepticism. The news of rare blood clots dominated the news, governments gave conflicting guidance, and the public was puzzled. And the anti-vaxxers got more ammunition for their kitty.

Perceptions of Risk in Life

Life is not risk-free. Let us start with the birth of a person: the chance of a child dying at birth in the US is 6 in 1000, 28 in India, 2 in Japan, etc. Once you survive that risky event, you get a 5 in a million chance of dying from murder, 100 in a million in road accidents, and 170 in a million pregnancy-related (all in the US). That, too, without considering the leading causes of death, namely heart disease and cancer. Does that prevent anyone from giving birth or travelling by road?

The Life of Trade-Offs

balance, scale, justice-154516.jpg

Consider this: 740,000 of the total 330 million population are dead in the US (as of today, 28/10/2021) due to COVID-19. It is not clear what proportion of the total population was infected. In other words, 0.74 in 330 (0.2 % or 2 in thousand) is a reasonable estimate of the risk of dying due to COVID-19. A similar calculation for India is 3 million deaths (from the median estimate for excess deaths in 2020-21, from various scientific assessments such as the one by Deshmukh et al., MedRxiv) of the total 1400 mln population. The ratio comes out to be 0.21%. A similar estimate for the UK is 140,000 (official count as of today) out of a population of 67 million, also 0.2%. Brazil is 0.28%, and the list goes on. Note that this represents the average risk of dying from COVID-19 (averaged over age, incident rate, comorbidities, suggesting that the case fatality ratio can only be higher).

[in fact, 0.2% seems so powerful that it is a good measure of identifying “cheaters” in this pandemic!]

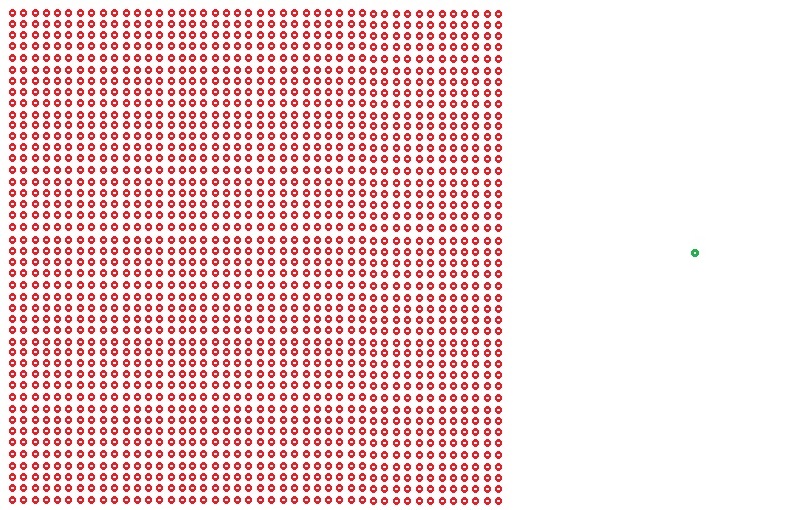
Now, what is the chance of dying due to vaccination? Based on various studies, it is about 1 in a million, slightly more than being struck by lightning in a given year in the US (1 in 1,222,000). So the comparison is between 2 in a thousand and 1 in a million. Or, it is a comparison between 2000 and 1. That is the trade-off you must make. What will you do?

Death due to Infection (red) vs Death by Vaccine (green)

And that is where we humans sometimes lose perspective.

PS: The author and his family are happy recipients of the ChAdOx1 nCoV-19 vaccine.

Further Reading

[1] Johns Hopkins University (JHU) dashboard

[2] Excess mortality in India: MedRxiv

[3] Vaccine and Deaths: Australian Academy of Science

Judgement of Risks and Decision Making Read More »

The Equation of Life

A 42-year-old mother of two, Sophie goes to a cancer screening centre in Los Angeles and does a mammogram. The results came in with bad news; she is positive for breast cancer. Still puzzled, she enquires the laboratory technician about the accuracy of the analysis. The technician says that the machine used for the test was 95% correct for detecting positives and 90% accurate for detecting negatives. What should she do now? What is the probability that she has breast cancer?

Bayes’ Theorem

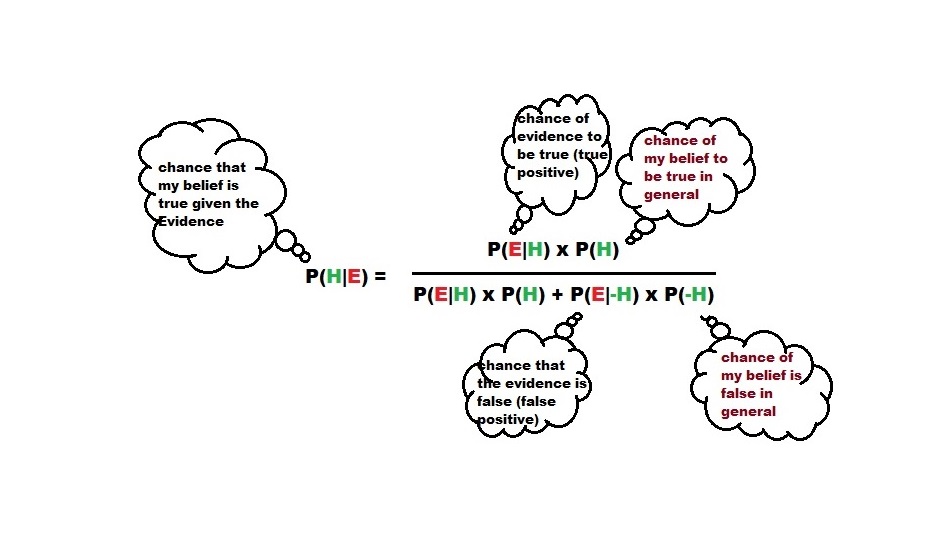
Before we get into what happened next in Sophie’s story, let’s try to understand one of the most important equations in statistics. I will write down the equation below. Just memorise it as if your life depended on this.

P (H|E) = P(E|H) P(H) / [ P(E|H) P(H) + P(E|-H) P(-H) ]. The letter P denotes probability, H the hypothesis (belief) and E the evidence (test results).

The equation is known as Bayes’ theorem, named after the famous 18th-century English statistician Thomas Bayes.

Quantify Your Beliefs

Now, let’s understand the equation and apply it to Sophie’s case. Let’s get the first term, P(E|H). P(E|H) is the chance of getting positive results for people who have breast cancer, something the technician told her, i.e. 95%. Note that this equals 0.95 if expressed as a fraction and is handy for our calculations. They call it the sensitivity of the test. The following term, P(E|-H), is the chance of getting a positive result despite having no breast cancer. Remember, the technician gave Sophie another number – 90% accuracy for catching negatives. They call it the specificity of the test. It tells you that for 100 healthy people, the machine correctly gives 90 negative results and wrongly gives 10 positive results (false positive). Now, we got P(E|-H), which is 0.1 (another way of saying 10%).

We still need two more terms to complete the calculations – P(H) and P(-H). P(H) is the general chance for Sophie to have Breast Cancer. That is a strange ask! How will she ever know that? Well, national statistics come in handy. Find out the average chance for a 42-year-old woman in the US to have breast cancer. Researching, Sophie finds from an American Cancer Society document that the probability for 40-year-old US women to have breast cancer is 1.5% (P(H) = 0.015). The last term is easy – the chance of a 40-year-old US woman not having breast cancer: 100 – 1.5 or 98.5 (P(-H) = 0.985).

Some Hope, at Last

Let’s plug in all the terms we collected so far. They are P(E|H) = 0.95, P(E|-H) = 0.1, P(H) = 0.015 and P(-H) = 0.985. The calculations become (0.95 x 0.015) / [( 0.95 x 0.015) + (0.1 x 0.985)]. The answer is 0.126 or 12.6%; not that bad, eh!

What options does Sophie have now?

She is feeling much better now. She now knows the real chance of having breast cancer, which is about 13%. She goes to the testing centre for a second test. She will find her results soon, and she understands how to update her chances; plug in all the numbers as before but with the updated value for P(H), which is 0.126.

[There are numerous explanations of Bayes’ them available online, e.g., the one by Veritasium].

The Equation of Life Read More »

The mind of a Goldfish

The distraction caused by the internet and social media has been a topic of intense debate. The argument is that the proliferation of the internet and increased access to information has reduced the human attention span to that of goldfish.

The claim is interesting for two reasons. At first, it points to humans and then to goldfish! Has the human brain/memory capacity now reduced to that of a goldfish? After all, what is goldfish memory, and is that too short? I don’t think either of these propositions is accurate; the claim on the fish is likely a fallacy (like “the doctrine of signature”.) You got confused by the frequent change of direction of the fish with its memory!

Cognitive Abilities of Multitaskers

Now, back to the topic of this post: in 2009, researchers at Stanford University published a paper titled “Cognitive control in media multitaskers” in PNAS ( Proceedings of the National Academy of Sciences of the United States of America).

The researchers chose two groups of individuals belonging to “Heavy Media Multitaskers (HMM)” and “Light Media Multitaskers (LMM)” and assigned tasks to find out the speed and accuracy of their performance. They also added distractors in the tasks as additional variables.

Multitaskers Lose out in Filtering Distractions

The speed and accuracy of both teams were comparable for the basic test. However, when researchers added irrelevant elements (distractions) to the tasks, the groups performed differently. The heavy multitaskers started making more errors, albeit maintaining the speed.

The results are indicators that the heavy multitaskers had difficulties filtering out irrelevant stimuli. But, is the study evidence to our original question on the information overflow and attention span? My answer is a firm no. I agree that the study showed a definite association between the two, but insufficient to make conclusions.

Causations or just Correlations?

Does the study prove that the internet destroys human memory? I will argue no. While the study confirms the association well, it is not sufficient to establish the root cause. What if the group of heavy multitaskers are prone to distraction by default? In other words, can you not conclude that their special cognitive features (hormonal, neurological make-up), which made them vulnerable to distractions, helped them to get into multitasking in the first place? In that case, the study proved the obvious or quite the opposite.

However, the results can make one mindful of the triggers around us, be it the countless click-bait of the internet or the use of multiple screens in the workspace. The study also reaffirms that irrespective of information overflow, multitasking is an individual’s choice, but know the price you pay, i.e., accuracy.

The mind of a Goldfish Read More »

The First Post

Here we start. ‘Thoughtful Examinations’ is about life, knowledge, and happiness. It’s about numbers, rationality, and perspectives. I welcome you to the experience.

The Life of Chances

Probability, the mathematics of chances, is tightly woven into the fabric of life. Our existence started, evolved, and was nurtured by countless unlikely events – some are linked, some are not. We all studied the subject at school, the endless tossing of coins! Yet, it’s rarely applied in life. We will see the subject of probability and statistics as a recurring theme of my posts.

The Gates of Knowledge are Open

The gates have been crashed; the doors are open. The Tree of Knowledge is no longer hidden from your sight. The internet has made access to knowledge to each one of us. The democratization of knowledge is complete! Remember chances: yes, the chances that you reach your goals are better than ever before.

The Happiness Project

This page is for all who enjoy learning new things or getting new perspectives. This piece is for people confused by the volume of information out in public, finding it hard to separate the truth from the sea of junk. This one is a happiness project.

Once again, welcome to this journey. I offer whatever that I can to make it enjoyable. Remember: life is about chances, rationality, and decision-making.

The First Post Read More »