Data & Statistics

Solar Power and Capacity Factor

Solar Photo Voltaic (PV) is the most direct pathway for converting solar energy to use, say, electricity. While sunlight is available everywhere, they don’t fall at the same rate in different parts of the world, in different months of the year. The rates are described as irradiance or the energy that hits a unit area every second (W/m2).

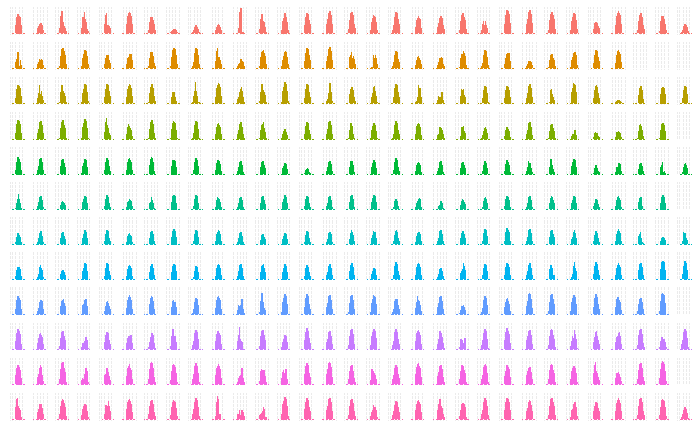
The following plot presents annual sunlight in one such location in Australia – irradiance against the hours of the day.

The plot also demonstrates one of the cool functions of R, factet_grid in ggplot. The code is presented below.

sol_plot <- sol_data %>% ggplot(aes(x = Time, y = Irradiance, colour = factor(Month)))+
  geom_bar(aes(), stat="identity", width=.5) + 
  facet_grid(Month~Day) + 

theme(strip.background = element_blank(), strip.text = element_blank(), axis.title.x = element_blank(), axis.title.y = element_blank(), axis.ticks.x = element_blank(), axis.text.x = element_blank(), axis.ticks.y = element_blank(), axis.text.y = element_blank())  + 
theme(legend.position="none")

sol_plot

The capacity factor is one handy parameter to remember while estimating the solar energy potential of a place. It is the actual amount of energy obtained (in MWh) in an average hour of the year if you install a one MW plant. You can get it by dividing the actual electricity output by the maximum possible output. The number typically varies between 10% – 30%.

Solar Power and Capacity Factor Read More »

Distributional Impacts and Net Energy Metering

While the entry of solar PV into the electricity mix has enabled the system to reduce carbon intensity, it created a new category known as distributed energy resources (DER). It became a complex problem for regulators as, on the one hand, they try to influence its adoption to customers by favourable discounts. But on the other hand, sometimes, it creates strange consequences for the non-adopters of DER.

Net metering is one of the mechanisms to incentivise adopters of (rooftop) solar PV. Burger et al. report a study on the topic in their working paper titled “Quantifying The Distributional Impacts of Rooftop Solar PV Adoption Under Net Energy Metering”. They used data on electricity consumption and income characteristics of 100,170 customers in Chicago, Illinois, which followed the net metering under default tariff.

The net metering scheme enables rooftop PV owners to push the unused electricity into the grid, and for every kWh, they receive the retail price. The question arises, what amount of money should one get back? Ideally, the sender should get the generation cost (energy cost) for every unit send. But it turned out that in the scheme that was in place, customers not only gained the generation cost but also part of the transmission and distribution costs! It happened because the latter were charged not as fixed prices but as volumetric charges (charges proportional to the energy consumed, kWh)!

And who are the adopters of rooftop PV? In the income scale, they were disproportionately more families of the higher income bracket. And naturally, this means when the grid owner recovers their fixed costs, they will charge more from the non-adopters, who are lower income classes, through volumetric charges.

Ironically, perhaps unaware of the underlying economics, the environmental groups also advocate for such schemes to continue in pursuit of increasing renewable penetration.

Distributional Impacts and Net Energy Metering Read More »

Bayesian inference

One of the simpler explanations for Bayesian inference is given by John K. Kruschke in his book, Doing Bayesian Data Analysis. As per the author, Bayesian inference is the reallocation of credibility across possibilities. Let me explain what he meant by that.

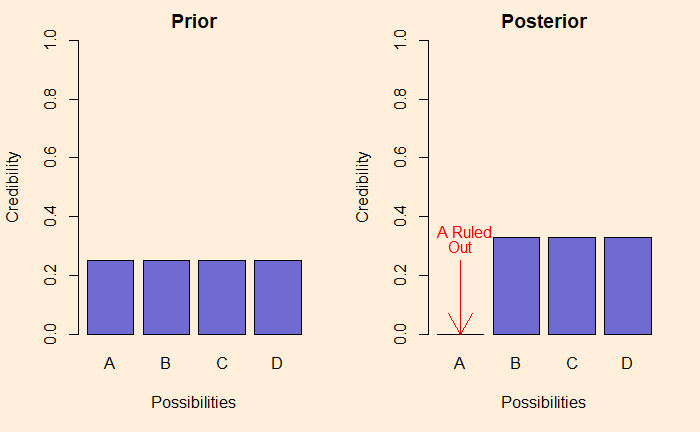
Suppose there are four different, mutually exclusive causes for an event. And we don’t know what exactly caused the event to happen. In such cases, we may give equal credibility, 0.25, to each. This forms the prior credibility of the events. Imagine, after some investigations, one of the possibilities is ruled out. The new credibilities are now restricted to the three remainings, with the weightage automatically updated to 0.33. We call the new set posterior.

If you continue the investigation and eliminate one more, the situation becomes as shown below.

Notice the previous posterior is the new prior.

Reference

Doing Bayesian Data Analysis by John K. Kruschke

Bayesian inference Read More »

Eight Little Speakers

Let’s solve a combination problem. There are eight speakers in a function whose turns come at random. What is the probability for the first three, A, B, and C, to speak such that A speaks before B and B before C?

Focus on A, B and C first and arrange the rest around them. The number of ways to arrange A, B, and C in that order among eight is 8C3. The number of ways of arranging the other five is 5! This means that the number of ways to set the three and five is 8C3 x 5! That forms the numerator. The denominator becomes the total number of ways of arranging eight people to speak, which is 8!

Therefore, the required probability becomes 8C3 x 5! / 8! = (8! x 5!) /(3! x 5! x 8!) = 1/3! = 1/6.

Eight Little Speakers Read More »

Another Coin-Tossing Game

Andy and Becky are playing a coin-tossing game. Whoever gets more heads win the game. Andy gets 100 tosses and Becky 101. If they both get the same number, Andy wins. What is the probability that Andy to win the competition?

Let’s do a Monte Carlo on this and find out who.

B<- 100000

results <- replicate(B, {
  Andy <- sum(sample(c(1,0), 100, replace = TRUE, prob = c(0.5,0.5)))
  Becky <- sum(sample(c(1,0), 101, replace = TRUE, prob = c(0.5,0.5)))
  if (Andy >= Becky){
    counter  = 1
  }else{
    counter = 0
  }
})

mean(results)

The answer comes out to be close to 0.5. What happens if they play only 2 and 3 games, respectively?

Another Coin-Tossing Game Read More »

Post # 365: What Have We Learned in One Year?

We started with the equation of life, Bayes’ theorem, how it mimics the natural learning process, and how even experts can not escape the curse of the base rate fallacy.

We understood the law of large numbers but failed to notice that there was no law of small numbers and continued gambling, hoping to even out, leading to complete ruin.

We have learned mathematically that at the Roulette table, the house always wins, yet we spent countless minutes watching YouTube videos learning strategies to beat the wheel. We also watched financial analysts all day on TV, reasoning on hindsight and glorifying market-beating fund managers, forgetting they were just the survivors of Russian roulette. The same people continue to make us believe in momentum and hot hands.

People gamble and play the lottery, where they are guaranteed to lose, and fail to invest for their retirement, where they are guaranteed to win. Three-quarters of Americans believe in at least one phenomenon that defines the law of physics, including psychic healing (55 per cent), extrasensory perception (41 per cent), haunted houses (37 per cent), and ghosts (32 per cent).

Rationality, by Steven Pinker

We have seen how journalism can mesmerise readers by reporting an 86% increase in myocarditis for the vaccinated, a 300% increase in thrombosis over oral contraceptives, or an 18% risk of colorectal cancer by eating processed meat. We just became easy prey for our inability to make decisions based on risk-benefit trade-offs and the eternal confusion between absolute and relative risks.

We found how the world can make us believe in diseases with causes and designs with a purpose when events were nothing but random processes. We see how careless choice of words and phrases and incorrect teaching lead to myths about evolution.

Even in an era of open data, data science and data journalism, we still need basic statistical principles in order not to be misled by apparent patterns in the numbers.

The Art of Statistics: How to Learn from Data, by David Spiegelhalter

The author was referring to variabilities in the observed rates of events when the population is small, which is the concept behind funnel plots.

We understand that international trade is a win-win for both parties, yet we let free rein to populism and Brexit. We know that the Muslim community in India is on the fastest downhill in the fertility curve, yet we want to believe that the opposite is true and continue believing in one-child policies.

We also know that life is not a zero-sum game and that probability theory is not another useless thing you study in schools and forget later, but it is about how we make decisions and appreciate life. The understanding, or the lack of it, can be a choice between life and death, as we have just witnessed in the global pandemic.

Could everyone have a fact-based worldview one day? Big change is always difficult to imagine. But it is definitely possible, and I think it will happen, for two simple reasons. First: a fact-based worldview is more useful for navigating life, just like an accurate GPS is more useful for finding your way in the city. Second, and probably more important: a fact-based worldview is more comfortable.

Factfulness, by Hans Rosling with Anna Rosling Rönnlund and Ola Rosling
Post # 365: What Have We Learned in One Year? Read More »

Emission Scopes – What They Say

The 2022 report of the Corporate Climate Responsibility Monitor assesses the latest status of 25 world-leading companies for their commitment to net-zero and actual performance.

The selected 25 reported combined revenue of USD 3.18 trillion, or 10% of the world’s top 500, in 2020. Their footprint (self-reported) added up to 2.7 GtCO2e/y; about 5% of the global.

The researchers looked at the ratings from CDP (the Carbon Disclosure Project) on transparency and 1.5°C-ratings from the Science Based Targets initiative (SBTi) on integrity. The notable finding from the report is the gulf between the target as they advertise and what they could achieve based on their actions so far.

Scope 3 emissions account for about 87% of the selected companies. And only about 8 of them had a reasonable plan to address emissions. One such credibility challenge is how companies plan to achieve carbon neutrality. The study raises its criticism over the (over) use of offset and nature-based solutions as the main strategies versus a plan for the absolute reduction of CO2 from activities.

Corporate Climate Responsibility Monitor

Emission Scopes – What They Say Read More »

Life Expectancy in Covid Times

The story of Covid-19 is getting three years old, and we are still getting the magnitude of the calamity it caused. One way of studying the impact is by mapping the change in life expectancy during the pandemic. Nature human behaviour has just published a paper on this topic, summarising data collected from 29 countries.

Understanding life expectancy

The calculations, known as the period life expectancies, are not a prediction but an estimate of how long a newborn will live if today’s death rate persists for her entire life. So these numbers will vary between 2020, when it was severe cases of Covid-19 with no vaccinations available, to 2021, where there were some mitigations available, to 2022, where the deadliness was relatively lower.

LE deficit

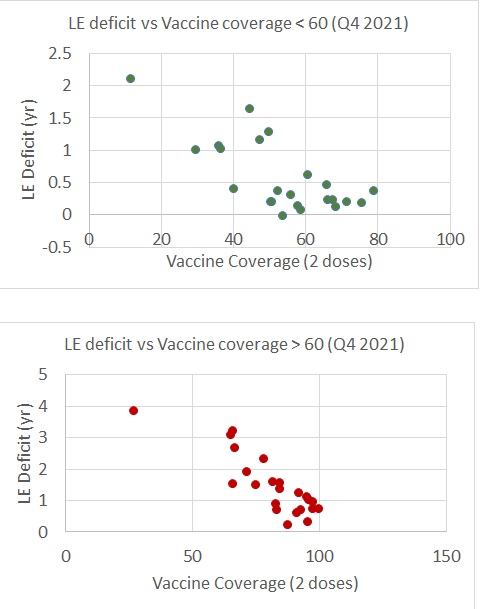
The researchers covered the change in LE rates of countries, that included Europe, the USA and Chile, since 2019, using data on all-cause mortality. They also define a term, LE deficit, which is the difference between the observed LE, and expected LE based on pre-pandemic estimates. Consider this: a country estimates an LE of 80 years in the last quarter of 2021. Imagine it was 79 years in 2015 and was slowly progressing upward (based on the trends from the past few years), and the expectation by Q4 2021 was 82. Then the LE deficit is 80 – 80 = 2 years.

There are a bunch of findings worth mentioning here:
Of the countries under investigation, only Finland, Norway and Denmark did not see a decline in LE (in comparison with 2019) in 2020.
Many Western European countries bounced back in 2021, i.e. positive change LE from 2020 to 2021, whereas most of Eastern European, the USA and Chile continued the fall.

One impressive trend was the correlation between vaccination coverage and life expectancy deficit.

Life expectancy changes since COVID-19: Nature Human Behaviour

Life Expectancy in Covid Times Read More »

Emission Scopes – Industries

Emissions accounting forms a pillar in the benchmarking of the industrial decarbonisation process. We have seen last time the categorisation (the scopes) of emissions. The relative contributions to these scopes vary from industry to industry. Today we discuss some of these variations based on the 2022 report published by the World Economic Forum.

The industrial sector accounts for about 30% of today’s global carbon emissions (excluding scope 3 emissions). Six sectors – oil, natural gas, steel, cement, aluminium and ammonia – take 80% of the share (without scope 3). The proportions of scopes 1, 2 and 3 of these sections are.

SectorScope 1
(Gt CO2e)
Scope 2
(Gt CO2e)
Scope 3
(Gt CO2e)
Oil3.212.3
NG2.17.6
Steel2.61.10.7
Cement2.40.20.8
Aluminimum1.080.03
Ammonia0.450.040.8

GHG Protocols

US EPA

World Economic Forum

Emission Scopes – Industries Read More »

Emission Scopes

We have seen how much is planet’s carbon budget and terms such as net-zero emissions to stay within the limit. These are as fine as targets. But how do we reach there, and how do we know we are on track? Answering these questions requires accounting.

One such thing is the standards defined by the greenhouse gas protocol. They provide the framework for businesses, governments and other entities. For companies, these led to the creation of scopes, which captures their direct and indirect emissions and the ones related to the supply chain.

Take an example of an oil and gas company. There are three scopes for the emissions. Scope 1 means the emissions related to the direct emissions from their operations, e.g., CO2 from the refinery, chemical plant or petroleum production. Scope 2 emissions are mainly the indirect emissions related to the energy they buy to run the operations, such as electricity, steam and heat. And finally, scope 3 happens when the customers burn the products they sell – petrol, diesel or kerosene.

GHG Protocols

US EPA

Emission Scopes Read More »