Science

Detox and Cleansers

The significance of detox is not just about spreading myths or exploiting human phobias; it’s also about the multi-billion dollar industry that thrives on our ignorance. But before we examine why it is pointless to try and clean your body by consuming something or doing some breathing exercise, let us first understand why ideas that flush out stuff from the body are sold so readily.

Easy to relate

It is easy to visualise accumulated dirt and the attack of enemies. If you have blocked drainage, you send liquid cleaners down. If the enemy attacks, send soldiers and smoke them out. It is a fallacy called the false analogy. Another one is the appeal to (common) belief. So, when your trusted traditional healer asks you to drink plenty of water and then vomit them out, you feel assured and feel happy after spitting out the bitter (must be the bad stuff in the body!) liquid.

Your real cleaner

Part of the reason we readily buy the plumbing argument is our lack of knowledge about our bodies. The liver is a vital organ in our body that, among scores of other things, is the gatekeeper against harmful substances. It breaks down the food we consume and sends the good stuff to the bloodstream and the waste to the kidneys.

Now, think about what happens when you drink your favourite detox drink, which contains a couple of vegetables, perhaps a lemon and a few herbs. It gets digested, nutrients are absorbed in the blood, and they reach the liver. Alas, not knowing this was a cleaner meant to clean it up, the liver breaks them down and packs any valuable things, e.g. vitamins, into the body and the waste to the kidneys.

What can you do for your cleaner?

The least you can do is not to overwhelm it. Avoiding the overconsumption of alcohol tops the list. Get vaccinated against Hepatitis (B and C), the viral infection that affects the liver. Finally, be careful with detox agents, especially the overload of unknown natural stuff, which often damages your liver or kidneys.

Read

Detoxing body: The Guardian

The water myth: McGill

Detox deception: The nature education

Body stuff with Dr Jen Gunter: TED

4 detox myths: MD Anderson

Detox and Cleansers Read More »
The Weight of Energy Transition

Global warming concerns everybody because it triggers climate change or the long-term change in the average weather patterns.

Not a small problem

The world needed 600 EJ (ExaJoules of energy) in 2019. So what is an ExaJoule? It is an energy unit, which equals 1018 Joules (1 followed by 18 zeros). To put it in perspective, the energy consumed by your 10 W LED bulb in one hour is 36000 Joules. Another unit to describe energy is TWh (terawatt hour). 600 EJ is approximately 167,000 TWh.

So, what is the issue with this energy? Out of this 600, 490 are directly connected to CO2 emissions. Or that energy is produced by burning fuels containing carbon atoms in it – you call it coal, crude oil or natural gas. Let’s look at the split in the year 2019.

OilCoalNatural
Gas
BiofuelsNuclearHydroWind
Solar
18716214057301513

The Weight of Energy Transition Read More »

Origins of the Black Death

We have been seeing some marvellous acts of bio-detectives in recent years. In yet another monumental feat of locating the proverbial needle in the haystack, scientists of the Eberhard Karls University of Tübingen have unearthed the origins of the bubonic plague of the mid-14th century.

In a paper published yesterday in the prestigious journal Nature, Spyrou et al. describe how DNA sequences of samples from seven individuals exhumed from two of the cemeteries in Kara-Djigach and Burana of the modern-day Kyrgistan.

The team collected the tooth samples from Peter the Great Museum of Anthropology and Ethnography in St Petersburg. The specimens were excavated between 1885 and 1892. The tombstone inscriptions suggest that the victims were dead between 1338 and 1339. DNA extractions were done from the tooth powder using standard extraction reagents, and voila: they see DNA sections of Yersinia pestis (Y. pestis), the bacterium responsible for killing about 60% of the population of western Eurasia!

What is more? The study identified the DNA as the common ancestor to the bacteria strains that ran havoc in central Eurasia.

The source of the Black Death in fourteenth-century central Eurasia: Nature

Origins of the Black Death Read More »

What happened to the Past Climate Predictions?

We have seen the role of climate models to understand the magnitude of global warming. Almost all of the narratives of catastrophe from the climate commentators go back to the output of climate models. And projections from these models play a crucial role in shaping our collective consciousness and aligning global policymaking to fight against this human-made problem.

Models also contribute to why the subject of global warming gets criticism from the sceptics. To most non-physicists, mathematical models represent fantasy, unconnected to reality. Also, projections are forward-looking, and it is easy to cast doubts in public minds for its alleged function as a crystal ball. Calling such people anti-science is easy but not entirely justified; after all, science too calls for the same; get the evidence and validate your predictions. So how do we validate a model prediction for the future?

Look for the past predictions!

Hausfather and others published a paper in the geophysical research letters in 2019 that exactly went for this. The work looked at various models published between the 1970s to the late 2000s. And what did they find? The team have gathered about 15 model predictions from the past and compared them with the observed data. They found that the predictions were well within the margin of errors of the observations. The models of the 70s, 80s and 90s were pretty accurate to predict the future, which is past by now!

What is a climate model?

A model gives a connection between an input and an output. It’s achieved using the physics of the process and represented through the language of mathematics. In the context of climate change, concentrations of CO2 in the atmosphere is the input, and the temperature rise (or fall) is the output. A typical model estimates the reason for the temperature change, i.e., the radiative forcing or the change in energy flux (the incoming – outgoing energy) on the planet. In other words, if the outgoing is less than the incoming, the temperature rises; otherwise, it falls, simple!

Why is this no news?

There are many reasons why a good match between a model and observations never makes it to the news. But, before getting there: why do you expect the predictions made by the collaborative works of 100s of top scientists to go wrong in the first place? We will explore the answer in another post. Now, let’s come back to why they didn’t become headlines. First, predictions happen today (which attracts news), but the data arrive 5-10 years later. By then, you may have forgotten about the original work! Secondly, matching an expectation does not make it sensational for the news. Imagine this news: “NASA scientists verified the physics of radiative forcing, again”! Third, a good match like this is more of a nuisance to the people who want to believe that climate change isn’t real (or who worry about the need to change the current lifestyle).

One such example is the projections made by NASA’s Hansen et al. in 1988. That story, in another post.

References

What happened to the Past Climate Predictions? Read More »

SSP in CMIP6

A key feature of the climate report is the abundance of acronyms, and the title for today’s post is a deliberate attempt to introduce a couple of them!

One of the goals for establishing a model framework is to forecast. And the prerequisite for reliable forecasting is a good fit with the historical data. We have seen in the previous post the importance of CMIP and the role of climate models to match the historical trends as much as possible.

SSPs

This projection of future scenarios is based on fives pathways, called Socioeconomic Pathways (SSP) – SSP1 through SSP5. These range from the mildest (impact to climate change) SSP1 (sustainable development) to the harshest SSP5 (high energy demand, fossil fuel development). These pathways are then combined with the global effective radiative forcing (ERF) values (W/m2) envisaged in 2100 to get the SSP matrix.

Representation of SSP scenarios

An SSP scenario is represented by the SSP pathway number followed by the 2100 forcing value. For example, the sustainable pathway at 1.9 W/m2 ERF is SSP1-1.9. Chapter 4 of the WG1 report of AR6 focusses on 5 scenarios SSP1-1.9, SSP1-2.6, SSP2-4.5, SSP3-7.0, and SSP5-8.5.

As per these scenarios, a 1.5 C increase of global mean surface air temperature (GSAT) is highly likely to occur in SSP5-8.5, likely to occur in SSP2-4.5, SSP3-7.0 and more likely than not in SSP1-1.9, SSP1-2.6 in the next 20 years!

Climate Reports: IPCC

Introduction to Climate Models, CMIP

SSP in CMIP6 Read More »

Climate Models

The backbone of the IPCC climate assessment is the Coupled Model Intercomparison Project (CMIP). The term coupled means that the model can evaluate the whole system, i.e., atmosphere and ocean. Intercomparison suggests that climate models, developed by various groups at different points in time, are harmonised using the same set of inputs (provided by CMIP). This way, if there are differences between models’ predictions, it can be assured that it was not due to variations in experimental design but due to the difference in physics or the mathematical treatments.

Climate models are mathematical representations of complex geo-chemical-physical aspects and relate various inputs to the observed features of global warming. It gives better control over the underlying science but more importantly, it serves as a framework for forecasting.

The tool, currently at version 6, is a collaborative framework aiming to improve the understanding of climate changes related to global warming. The tool compares climate models, developed by various groups, with the experimental data and to each other.

The multi-model mean captured by CMIP6 closely matches the Global Mean Surface Temperature (GMST), although there can be differences in the predictions of individual models with the observed data.

Climate Reports: IPCC

 Introduction to Climate Models, CMIP

Climate Models Read More »

Many Indicators, One Message

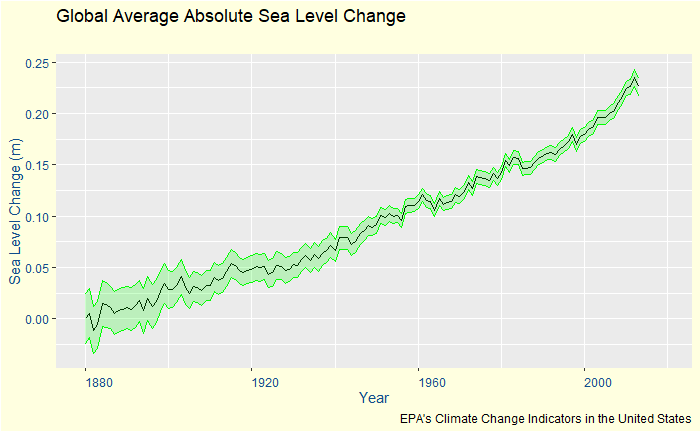
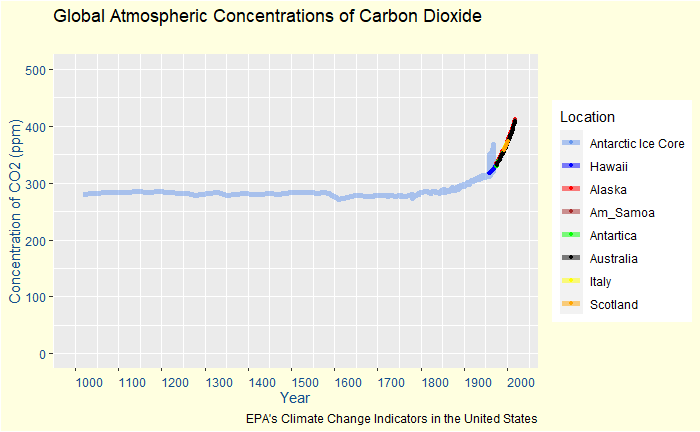
We may divide the ecological system we reside in into four parts viz., atmosphere, biosphere, cryosphere and oceans. The climate report makes an exhaustive list of evidence of changes in these sub-systems. Some of them, such as the rise in sea levels and the increased frequency of floods, prove direct evidence for a changing climate, whereas the others, e.g. temperature rise or elevated levels of greenhouse gases in the atmosphere, are evidence of its root causes.

Data from atmosphere

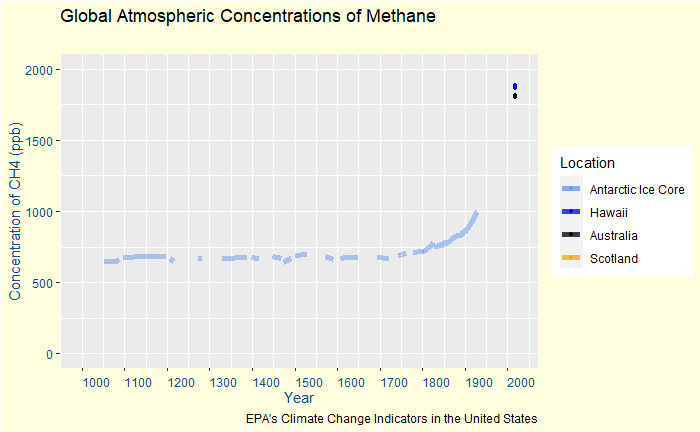
The first and foremost is the carbon dioxide (CO2) in the atmosphere. Its concentration had reached 409.9 (+/- 0.4) ppm in 2019. Similar values for the other greenhouse gases (GHG) were methane 1866.3 +/- 3.3 ppb and nitrous oxide 332.1 (+/-0.4) ppb. This level of CO2 is the highest in the last two million years! These molecules are ominous for the system because of their power to influence the so-called Effective Radiative Forcing (ERF); the subsequent increase of energy causes warming in the system.

Data from biosphere

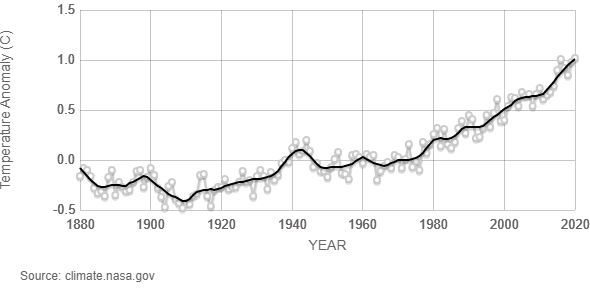
Global Mean Surface Temperature (GMST), the poster boy of climate change crisis, has increased by over 1.09 oC [0.95 – 1.20] since industrialisation; 1.59 oC for land and 0.88 oC for oceans.

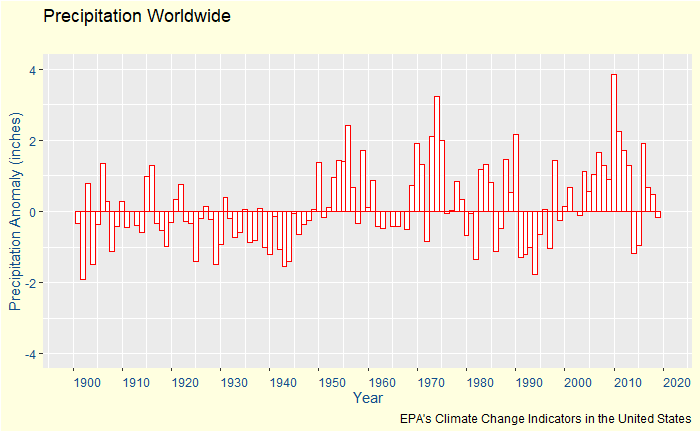
Global land-precipitation has increased since 1950, and its pace has further picked up since the 1980s.

Data from cryosphere

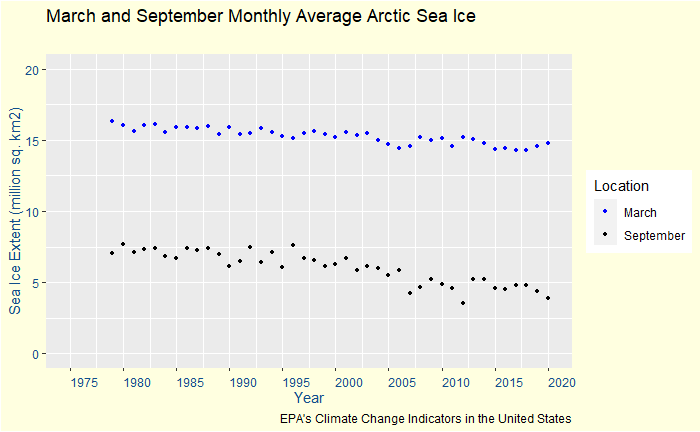
The annual mean and the late-summer values of Arctic ice coverage are the lowest since 1850. The decadal means of Arctic sea ice area has decreased from 6.23 million km2 in the 1980s to 3.76 million km2 in the last decade for September and from 14.52 to 13.42 million km2 for March.

Data from oceans

The global mean sea level (GMSL) has risen by 0.2 m since 1901, and the rate is accelerating. On the other hand, the ocean heat content has increased, pH and oxygen contents have decreased.

Climate Change Indicators: US EPA

Climate Reports: IPCC

Many Indicators, One Message Read More »

AR6 is getting Ready

The first two Working Group (WG) reports of the sixth assessment (AR6) of the Intergovernmental Panel on Climate Change (IPCC) is now available for public view. Two more reports – the third working group (WGIII) and final synthesis report (SYR) – are due later this year.

IPCC and working groups

IPCC, formed in 1988 by World Meteorological Organization (WMO) and United Nations Environment Programme (UNEP), is the United Nations (UN) body for assessing the science related to climate change. The body has done an honourable job for more than 30 years in providing policymakers with scientific information about climate change. While IPCC does not conduct its research, it gathers input from thousands of scientists and mathematicians working in this field globally and facilitates expert review.

It has three working groups and a task force. WGI deals with the science of climate change, WGII its impact and the third group, WGIII, concerns the mitigation plans.

Assessment cycles

The current assessment cycle, the sixth, started from where the fifth had ended (2013-14) and has its first report (AR6-WGI) released in 2021.

WGI: physical science basis of climate change

Through its 12 chapters spread over 4000 pages, the report summarises the current state of knowledge about climate information and human-induced climate change. We’ll go through some of its findings in the next post.

AR6 is getting Ready Read More »

MtDNA Knows It All

You may know that our cell nuclei contain genomic DNA – parts of it possess the codes (genes) that determine all the traits. We obtain this from our parents through some combination.

Enter mitochondrial DNA (mtDNA). It is not your usual type. First, it lies inside mitochondria and not the cell nucleus. Second, it is inherited from the mother alone; fathers do not contribute. Third, it does not recombine. What is so special about this? Well, mtDNA has become the tracer molecule to study relationships between one individual to another.

The absence of recombination and bi-parenting inheritance made these molecules scientists’ pet for tracing the maternal ancestry of human beings. And they traced back thousands and thousands of years and ended up at a single mother who lived ca. 200,000 in Africa. She is called the Mitochondrial Eve. She was not the first human but became the meeting point (common ancestor) when human mtDNAs were all traced back.

MtDNA Knows It All Read More »

A Gene that is Selfish and A Brain that is Not

This post is not a commentary on the book Selfish Gene by Richard Dawkins, although I do recommend the book. But this is around how to understand what is selfishness.

It seems scientists often forget about the common public when it comes to naming their books or concepts. That way, the title, selfish gene, is just another one: survival of the fittest, natural selection, god particle, the list goes on. None of these phrases represents what they truly meant. God particles have nothing to do with god, survival does not correlate with any physical fitness, or there is nobody in nature to select or reject anything.

Selfishness in biology simply means the ability to survive no matter what. It has little to do with a species’ deliberated actions using its brain, such as mating (or not mating), not sharing resources, stealing or killing. It only means making copies and preserving genes by passing from generation to generation.

What a headless virus can do

Take the case of the most popular show in town, the novel coronavirus, SARS-CoV-2 or Covid-19. The virus has two parts, the outer envelope, which has a bunch of proteins, including the famous spikes, all embedded in a lipid membrane and the inside material that contains the genome, a single-stranded RNA, preserved nicely on a protein called the nucleocapsid or N-protein. The genome is long and contains information to make new viruses using someone else’s workshop, the human cells.

The virus thus mobilises human cell machinery (e.g. ribosomes) to replicate. It creates billions of copies that infect millions of people. And the virus does all these without having a body or a brain!

Brain doesn’t need to follow

Human genes, too, want to preserve themselves. They are also selfish and want to be immortal. But it has a master, the human brain, which can overrule the instincts for the greater good. It may have inherent altruism, but more importantly, it is trainable based on a value system. While the brainless gene wants and will long for eternal life, you, as a human, can prefer not to have offspring. You may stop taking sugar, run for hours when no lion is chasing, donate organs to strangers.

A Gene that is Selfish and A Brain that is Not Read More »