Science

Disease of the Decent

Parkinson’s disease accompanies the loss of dopaminergic neurons responsible for synthesising the neurotransmitter dopamine. Dopamine is often known as the molecule that controls motivation through a reward mechanism. Naturally, the chemical earned the reputation of being responsible for addiction, pleasure etc.

An illness negatively correlated with an addiction-causing chemical is thus an ideal candidate for seeing confounding. Let’s take some well-known addictions, namely coffee, smoking and alcohol.

Coffees’ negative correlation with Parkinson’s is something we have seen earlier. Next up is smoking, and lo and behold, smoking is associated with a lower tendency of Parkinson’s disease! Now, I have no choice but to search for alcoholism. This one appears more complex. Most of the studies showed no association or weak negative correlation.

Confounding, is it?

It has all the ingredients to be a confounding phenomenon. But until a new study came up with a mechanistic explanation – Nicotins effect on neuron survival.

Disease of the Decent Read More »

420 Remaining in the Bank

Here is an update on the global carbon dioxide (CO2) situation. If you need a background on the topic, you may go to my previous posts on this topic. The world needs to restrict the average temperature rise, from the pre-industrial level, to below 1.5 oC to avert catastrophic climate changes. For simplicity, take 1850 as the start of the counting. 1.5 oC corresponds to a median concentration of CO2 of about 507 ppm (parts per million) in the atmosphere (425-785 ppm at 95% confidence range).

From these numbers, one can estimate the quantity of CO2 we could throw into the atmosphere before it crosses the critical concentration. The maximum remaining quantity of CO2 is known as the Carbon Budget.

Now the numbers: Based on the latest estimate at the beginning of 2022,

ItemQuantityUnit
Carbon Budget420GtCO2
CO2 Concentration414.7ppm
Global anthropogenic CO2 emissions
(2021)
39.4GtCO2
Global fossil CO2 emissions
(2021)
36.4GtCO2
Gt = Gigatonne = billion tonnes; anthropogenic = originating from human activity; 39.4-364. = 3GtCO2 comes from land usage

Spending Wisely

At the current rate, the budget will be over by 2032! There is a resolution from the global fraternity to reduce the net CO2 emission to zero by 2050. If we trust that commitment, one can draw spending scenarios to reach the target. If we spend the remaining 420 Gt in equal chunks, we can do it by spending 15 Gt every year until 2050 and put a hard brake, which is not practical, given the present lifestyle of 36.4 Gt/yr. Another scenario is by reducing 8% every year. Notice that an 8% yearly reduction corresponds to halving every nine years. In other words, the spending in 2030 has to be half of what we did last year.

And How are we doing?

Nothing to cheer about (so far). The emission figures from the last three years have been:

YearTotal CO2 Emitted
(GtCO2)
at 8% reduction
(GtCO2)
201936.736.7
202034.833.8
202136.431

Since we know the real reason for the decline in 2020, the global shutdown due to pandemic, the 8% reduction remains a project without any evidence of progress.

CO2 at 1.5 oC: UK Met office
Carbon Budget Preliminary Data: ESSD

420 Remaining in the Bank Read More »

A moth named Biston betularia

Industrial melanism is a term to familiarise. Biston betularia, the “poster moth” of evolution through natural selection, made this word immortal. You may call it a victim of the Industrial Revolution (or the coal pollution of England). However, the transformation of this humble creature provided the most powerful illustration of the theory of evolution and accelerated its inevitable journey towards becoming a theorem.

To give a brief background: Biston betularia is a type of peppered moth that had transformed from its pale (typica) form to black (carbonaria) in the last decades of the nineteenth century, coinciding with the industrial revolution in England. The hypothesis for the observed shift is that the pale varieties became prey to the bird predators as the former had become easily distinguishable on the blackened walls of industrialised cities of England, thanks to the coal revolution (and pollution). Accidental mutant varieties with black shades saved themselves from the lookout of the predators and became the most abundant species in the 20th century and continued until a few decades ago.

We have seen it before but repeating. Polymorphism is where two individuals differ in their DNA sequence, and the less common variant is present in at least one per cent of the people tested. The simplest type of polymorphism is when there is a single-letter change in a genetic sequence. That is called a Single Nucleotide Polymorphism (SNP).

Scientists have recently discovered the locations (the sequence and the genes) of the mutations that caused the change of colour from pale to dark. Further, analysis by statistical inference has found that the transposition happened around 1819, consistent with the actual observation of the change (from the dominance of the pale population to the black).

Noone sees its evolution!

The story of the peppered moth’s evolution is both fascinating and confusing. First, we need to realise that an individual white moth never transforms into a back one in its lifetime; the celebrated illustration (The Road to Homo Sapiens) of Rudolph Zallinger may tell you otherwise. It was a crime, though unknowingly, the artist committed against science that etched this faulty image – of an ape transforming into an upright man – permanently into the human psyche. Evolution is not a conscious conversion of one species to another. For example, the original white-moth-dominated society and the new black-dominated can easily have a hundred generations of separation.

Humans, the moths of glass sponges

We can see a moth’s evolution in front of us because a moth has a short lifetime – a few months at the maximum. In other words, given a few decades, we could see a few hundred life cycles of moths. Human evolution is not visible to humans because we can never see a thousand generations of ourselves unfolding before us. That is why we go after evidence, and science delivers. In doubt, ask a glass sponge who has survived this planet for 10,000 years!

The industrial melanism mutation in British peppered moths: Nature

Polymorphism: NIH

Longest surviving living organisms: wiki

The road to homo sapiens: wiki

A moth named Biston betularia Read More »

Myopic Discounting

General preference for short term rewards as against deferred payoff is well known. We have already seen it from the tests done by Prof. Frederick. Subject’s selection for $100 now vs $140 a year later, 30 min massage in 2 weeks vs 45 min massage in November, $3400 this month vs $3800 next month; the list is endless.

The individuals who go for immediate rewards undervalue prizes that are achievable some time in future. Put it differently, they discount the value of the future payoff higher (if it’s money, higher than what is practically achievable from the market) and wait for increasing the benefit until it meets their criteria. The phenomenon is known as temporal discounting. In other words, people with high values of temporal discounting possess myopic discounting.

A study published in The Journal of Neuroscience (2010) used subjects with lesions in their prefrontal cortex to establish the role of the brain in discounting behaviour. Participants included 16 people with brain damage and 20 healthy, as evidenced by MRI and CT images of their brain.

The subjects were given various temporal discounting tasks involving fictitious incentives of money, food, vouchers etc. The results showed a remarkable difference between healthy subjects and the non-healthy. A higher discounting committed by people who damaged their medial orbitofrontal cortex (mOFC) of the brain suggests the importance of mOFC in having clarity about future outcomes in decision making.

Sellitto et al. The Journal of Neuroscience, December 8, 2010, 30(49):16429 –16436.

Myopic Discounting Read More »

The Vos Savant Problem

In my opinion, the Monte Hall problem was not about probability. It was about prejudices.

The trouble with reasoning

Logical reasoning has enjoyed an upper hand over experimentation due to historical reasons. Reasoners and philosophers commanded respect in society from very early history. It was understandable, and science, the way we see it today, was in its infancy. Experimentation and computation techniques did not exist. But we continued that habit even when our ability to experiment – physical or computational – has improved exponentially.

I have recently read an article on the Monty Hall problem, and in the end, the author remarked that the topic was still in debate. I wonder who on earth is still wasting their time on something so easy to find experimentally or by performing simulations. Make a cutout, collect a few toys, call your child for help, do a few rounds and note down the outcome. There you are and the great philosophical debate.

Thought experiments are thoughts, not experiments!

Thought experiments, if you can do some, are decent starting points to frame actual experiments and not the end in itself. The trouble with logical reasoning as the primary mode of developing a concept is that it creates an unnecessary but inevitable divide between a minority who could understand and articulate the idea and a large group of others. Evidence that emerges from experiments, on the other hand, is far convincing to communicate to people. The debate then shifts to the validity and representativeness of the experimental conditions and the interpretation of results.

Monte Hall is relevant

The relevance of the Monty Hall problem is that it tells you the existing deep-rooted prejudices and sexism in society. The topic should be discussed but not as an example for budding logical reasoning or the eloquence of mathematical language. If someone doubts the results, which is very ‘logical’, the recommendation should be to conduct experiments or numerical simulations and collect data.

Philosophy, like psychology, has played its role in the grand arena of scientific splendour as the main protagonist. The time has come for them to take the grandpa roles and give the space for experimentation and computation.

The Vos Savant Problem Read More »

It will rain 40% tomorrow!

Weather reports are perhaps the most commonly encountered examples of probability in our daily life. For instance, the chance of precipitation for tomorrow is 40%. We know that there is only one chance of tomorrow happening, and only two possibilities – it rains or doesn’t. Then what does this 40% mean?

Let us start with what it is not. 40% rain does not mean it will rain 40% of the time or on 40% of the area!

One interpretation is that it rained 40 out of 100 days of similar weather patterns like tomorrow in the past. This interpretation relates closely to the climatology method of weather prediction, where past weather statistics guide the future. But whether predictions of today are far more advanced.

These days, weather forecasters run advanced mathematical models that take into account wind velocity, humidity, temperature, pressure, density etc. Even tiny errors in some of these variables can make the prediction off by a mile. Therefore, different models with several modes of sensitivities are solved to get an ensemble of outcomes. In the end, the Meteorologist looks at how many of them predicted rain. Suppose 20 out of a total of 50 realisations (model outcomes) predicted rain; the forecast becomes 40%.

It will rain 40% tomorrow! Read More »

What’s Wrong With Coffee?

Conflicting reports on the health benefits of drinking coffee is a topic of debate and confusion, often made science and scientists subjects of jokes. Over the years, several researchers have tried to establish associations between consuming coffee and a bunch of outcomes such as hypertension, cancer, gastrointestinal diseases – you name it.

Why these discrepancies?

Many of these studies are observational and not interventional. To make the distinction, cohort studies are observational, whereas randomised controlled trials (RCTs) are interventional. Establishing causations from observational studies is problematic.

In addition, coffee contains over 2000 active components, and theorising their impact on physiology, with all possible synergistic and antagonistic effects, is next to impossible. See these observations: taking caffeine as a tablet causes four times the elevation of blood pressure compared to drinking caffeinated coffee. There is an association of elevated BP with caffeinated drinks but none with coffee. So, accept this is complex.

Jumping to a conclusion is another issue. Researchers are often under tremendous pressure to publish. And like journalists, they too get carried away by results with sensation content. As a result, the authors (and readers) advertise relative risks as absolute risks, forget confidence intervals, shun the law of large numbers (or the absence of the law of small numbers) or ignore confounding factors!

Confounders

How will you respond when you hear a study in the UK that found an association between coffee drinking and elevated BP? First, who are those coffee drinkers in the land traditionally of tea lovers? If it was the cosmopolitan crowd, are there lifestyle factors that can have a confounding effect on the outcome of the study: working late hours, lack of exercise, higher stress levels, skipping regular meals, smoking?

The same goes for the beneficial effect of coffee on Parkinson’s disease. What if I argue that people with a tendency to develop the disease are less interested in developing such addictions due to the presence or absence of certain life chemicals? In that case, it is not the coffee that reduced Parkinson’s, but a third factor that controlled both.

Absolute or Relative

The risk of lymphoma is 1.29 for coffee drinkers, with a confidence interval ranging from 0.92 to 1.8. What does that mean? 30% of people who drink coffee get lymphoma? Or a relative risk with a wide enough interval that enclosed one inside it? If it is a relative risk, what is the baseline incident rate of lymphoma? More questions than answers.

Meta-analysis

Meta-analysis is a statistical technique that combines data from several already published studies to derive meaning. A meta-analysis, if done correctly, can bring the big picture from the multitudes of individual findings. The BMJ publication in 2017 is one such effort. They collected more than 140 articles published on coffee and its associated effects that provided them with more than 200 meta-analyses, including results from a few randomised controlled studies.

The outcome of the study

  1. Overall, coffee consumption seems to suggest more benefits than harm!
  2. 4% (relative risk)[0.85-0.96] reduction in all-cause mortality.
  3. A relative risk reduction of 19% [0.72-0.90] for cardiovascular diseases.
  4. Same story for several types of cancers, except for lung cancer. But then, the association of a higher tendency for lung cancer was reduced when adjusted for smoking. For non-smokers, on the other hand, there is a bit of benefit, like in the case of other cancers.
  5. Consumption of coffee leads to lower risks for liver and gastrointestinal outcomes—similar association for renal, metabolic, and neurological diseases such as Parkinson’s.
  6. Finally, something bad: harmful associations are seen for pregnancy, including low birth weight, pregnancy loss, and preterm birth.
  7. Many of these associations are marginal, and also the domination of observational data reduces the overall quality of conclusions. These results would benefit from more randomised controlled trials before formalising.

Meta-Analysis: NCBI

Randomised Controlled Trials: BMJ

Confounders contributing to the reported associations of coffee or caffeine with disease: NCBI

Coffee consumption and health: BMJ

Coffee and Health: Nature

What’s Wrong With Coffee? Read More »

Probability of Streaks

You have seen the binomial theorem. If you toss a coin 7 times, what is the chance of seeing all heads? It’s (1/2)7 = 0.0078 – less than a 1% chance! Now, what is the chance of seeing 7 consecutive heads at least once if you toss 200 times?

Let’s run this R code on random sampling and do Monte Carlo simulations to average it over 10,000 instances of 200 coin tosses.

library(stringr)

trial <- 10000

streak <- replicate(trial, {
toss <- sample(c("H", "T"), 200, replace = TRUE, prob = c(0.5,0.5))
toss1 <- paste(toss,collapse=" ")
count <- str_count(toss1, c("H H H H H H H"))

})

mean(streak)

Chance is more than 75%

Ok, what is the chance of seven heads if the probability of heads is increased slightly to 20/38? Almost always. There is a reason for this strange-looking probability of 20/38. That is next.

Probability of Streaks Read More »

Chance of Having a Healthy Pair of Chromosomes

Here is a question. A lady has a brother who has haemophilia. Their parents did not have the disease, and her two sons also did not have any issues. What is the chance that the lady has a fine pair of X chromosomes? No other information.

Haemophilia is an inherited genetic disorder and is associated with X chromosomes. Typically, women have a low probability of having the condition as the likelihood of having errors in both the X chromosomes is low.

So, how do we work out the problem? The brother has haemophilia, which suggests that one X chromosome of their mother has the error. Why? Father can only give his Y to the son. Additionally, the father did not have the condition, suggesting his X was healthy. Now, the mother can pass the error or the error-free X to her daughter. So there are two chances: the lady has two healthy Xs (A) or one error X (notA). Since she has sons, their X must have come from her. The two children are unaffected (B).

The probability of two healthy sons if the lady has two healthy Xs, P(B|A) = 1. The chance of two healthy children if the lady has one unhealthy X, P(B|notA) is (1/2)x(1/2) = 1/4. P(A), the lady has healthy XX = (1/2) and P(notA), one unhealthy X = (1/2). We have everything. Call Mr Bayes.

The chance of the lady has a healthy XX, given that her two sons are healthy,

P(A|B) = \frac{P(B|A)  P(A)}{P(B|A) P(A) + P(B|notA) * P(notA)} \\ \\  = \frac{ 1  (1/2)}{1  (1/2) + (1/4)(1/2)} + \frac{ (1/2)}{(1/2) + (1/8)}  = 8/10

= 80%

Chance of Having a Healthy Pair of Chromosomes Read More »

Boy or Girl?

Our results indicate that the sex ratio at conception is unbiased, the proportion of males increases during the first trimester, and total female mortality during pregnancy exceeds total male mortality; these are fundamental insights into early human development.

Orzack et al, (2015), Proceedings of the National Academy of Sciences

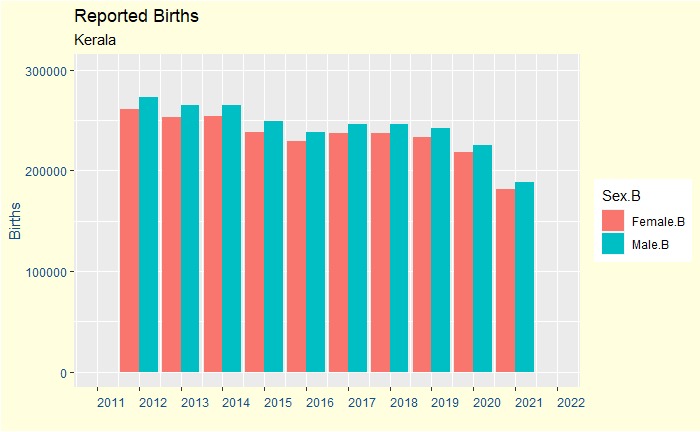
This post follows an old newspaper report – about the falling female/male ratio at birth in Kerala, a state in India that boasts its high female to male ratio in the population. The news suspected selective foeticide as the reason for this, a familiar allegation against many rich states of India.
Let us start with the data (the data in 2021 is incomplete):

What happens in the rest of the world?

As per the data put together by the World health organisation (WHO), males to female ratio in several parts of the world ranges between 104 to 106, with a few high-profile outliers such as China (113), India (110), Pakistan (109), Vietnam (112).

What does science tell?

Orzack et al. published a thorough research paper in 2015 on this topic. The team has collected data starting with 3-6 days old embryos and all the way to live births and mapped out the whole trajectory – from conception to childbirth.

The Sex Ratio (SR) is defined here as the number of male children divided by the total; SR = 0.5 means an unbiased state, > 0.5 biased for males. The SR at conception is the Primary Sex Ratio (PSR).

The analysis of data from Assisted Reproductive Technology (ART) suggested that the PSR (sex rate at conception) was close to unbiased, at 0.502 (95 confidence interval between 0.499 and 0.505). The sex ratio becomes slightly female biased within a week or two due to more male embryos being (chromosomal) abnormal (and results in death). It changes to 0.511 by week 6-12 (first trimester) and 0.559 by week 20 (second trimester). The findings are consistent with the observed data of higher net female mortality during the first and second trimesters. It starts decreasing due to higher male mortality in the third trimester. You add up all these dynamics and get the final SR of 0.51 or 105 males per 100 females at birth.

So was there a concern?

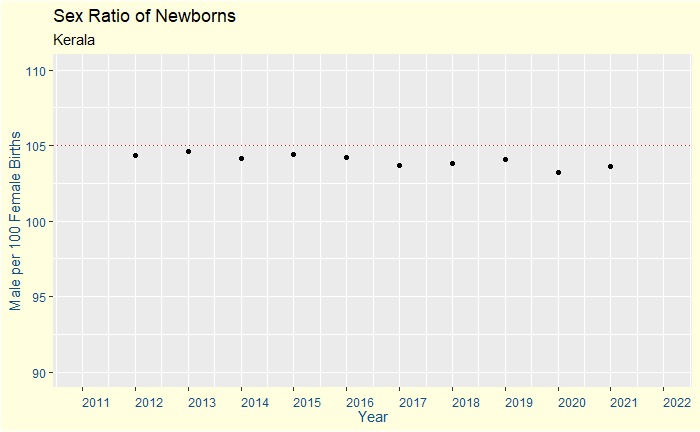
The short answer to the initial question (Kerala) is a NO. Look at the data in the last ten years. The plot below shows the number of males per 100 females, and the red dotted line represents 105.

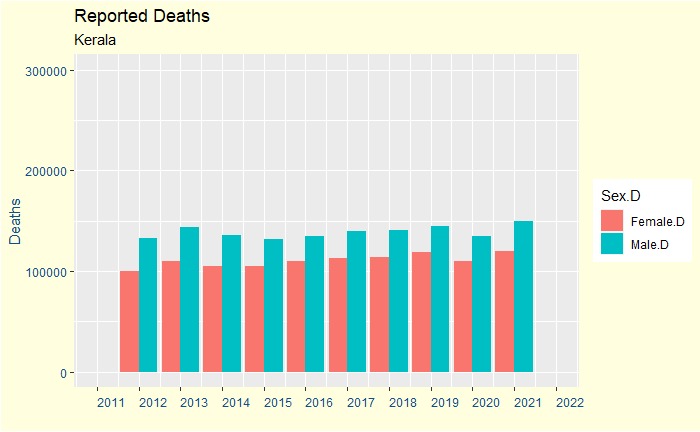
On the other hand, a glance at the yearly death data suggests a bias for males over females.

One can never prove the absence of selective foeticide against girl children. But the overall data doesn’t show any ‘abnormal’ features. It is equally impressive to know that females eventually gain back control in the final population figures due to their higher life expectancy.

Orzack et al, (2015). The human sex ratio from conception to birthProceedings of the National Academy of Sciences, 112(16), E2102-E2111

Sex Ratio at Birth in India: UNFPA

Selective Abortion: BBC

Sex Ratio at Child Birth: WHO

Why are more boys: NPR

Boy or Girl? Read More »