Life

Ecological fallacy

A lot of data we know describe the general trends of a region or group than from its members. E.g. the crime rate of a city is estimated based on the total number of crimes divided by the number of people. It is not calculated based on surveys of every individual member. A city can be high in crime rates, yet 99% of the individuals are not under any threat to their life or property. In other words, there may be a few pockets in the city that experience disproportionately more crimes than the rest.

Ecological fallacy describes the logical error when we take a statistic meant to represent an area or group and apply it to the individuals or objects inside. It gets the name because the data was meant to describe the system, the environment or the ecology.

A lot of stereotypes arise out of ecological fallacy. A well-known example is racial profiling, in which a person is discriminated against or stereotyped against her ethnicity, religion or nationality. Simpson’s paradox, something we had discussed in the past, is a special case of ecological fallacy.

A classical case was the 1950 paper published by Robinson in American Sociological Review. He found a positive correlation between migrants (colour) and illiteracy. Yet, he found, at the state level, a negative correlation (-0.53) between illiteracy and the number of people born outside the US. This was counterintuitive. One possible explanation is that while migrants tend to be more illiterate, they tend to migrate to regions that are, on average, more literate, such as big cities.

Robinson, W. S; American Sociological Review, 1950, 15 (3),  351-357.

Ecological fallacy Read More »
Irrational Faith in Guns

If having a gun increases the risk of gun-related violent death in the home, why do people choose to own guns?

Pierre, J. M., “The psychology of guns: risk, fear, and motivated reasoning”, Palgrave Communications, 5, 2019

My thoughts go with the children, teachers at the Robb Elementary School in Texas, and their family members.

I will start with my viewpoint on this debate of whether guns kill people vs people kill people – people attack, and they use readily available weapons to cause harm to “the other“. The more lethal the tool used, the deadlier the injury, with death as the endpoint. In other words, if stones are accessible, the outraged may throw and hurt the other, and if guns are accessible, they may kill a few; in a more barbarian society, replace guns with bombs! Only the scale changes. It is as simple as that.

There are statistics, and so are beliefs

In one of the previous posts, we discovered that suicides dominated the gun-related deaths. Studies after studies report the association that homicides are largely incidents committed by family members and acquaintances and not strangers.

Yet, the society, the US in this context, supports and takes great pride in possession of guns! The proponents of guns have several reasons (excuses) to support their position, starting with individual freedom (we have seen it in Covid-19 mask mandates!), to what is known, as per some studies, as the knowledge deficit model.

But one theory that became the most prominent among them points to the aspect of human decision making – i.e., irrationality, controlled by cognitive biases (cherry-picking, motivated reasoning, availability heuristics, status quo bias). As per Metzl, this behaviour stems from the notion of the cultural heritage of gun owners. And it does not come as a surprise that other social cancers (a.k.a. resistance to progress) – religiosity, racism, sexism, nationalism – too originate from similar backgrounds.

The Second Amendment

The story goes back to the second amendment of the US constitution that states, “A well regulated Militia, being necessary to the security of a free State, the right of the people to keep and bear Arms, shall not be infringed.”

First, you need to remember that this followed centuries-old practices of England (English Bill of Rights of 1689), which was embraced and ratified by the US constitution in 1791. And the reason to carry this baggage of the past? The answer is complicated.

Social scientists have been approaching this American love of guns through the lenses of gender, masculinity and race. On top of these, there are the thriving forces of fear of “bad guys, thugs and carjackers“, amply fostered by the ever-powerful National Rifle Association (NRA).

Uncertain future

A solution based on rational, data-based arguments is unlikely to reap any rewards against motivated reasoning. The issue is deep-rooted in American society as a national identity, symbol of resistance, and a collective history of race, gender and socioeconomic status. And as always, such diseases require long term care to heal.

Further Reading

Metzl, J., What guns mean: the symbolic lives of firearms, 2019, Palgrave Comm., 5:35
Pierre, J. M., The psychology of guns: risk, fear, and motivated reasoning, 2019, Palgrave Comm., 5:159

Irrational Faith in Guns Read More »

What Monty Must Do

This one is about what Mr Monty shouldn’t do in the game show! The discussion on the “ideal” Monty Hall problem is available in a different post. Nonetheless, a quick proof is here. Suppose the player chose door 1 and Monty opened door 2, the probability of the car behind door 1 given Monty opened door 2 is P(C1|D2). Applying the Bayes’ formula,

\\ P(C1|D2) = \frac{P(D2|C1)*P(C1)}{P(D2|C1)*P(C1) + P(D2|C2)*P(C2) + P(D2|C3)*P(C3)} \\ \\ P(C1|D2) = \frac{(1/2)*(1/3)}{(1/2)*(1/3) + 0*(1/3) + (1*(1/3))} = \frac{1}{3} \\ \\ P(C3|D2) = 1 - 0  -  P(C1|D2)  = \frac{2}{3}

Explanation

The prior probabilities, P(C1), P(C3) and P(C3), are all equal at 1/3. P(D2|C1) = 1/2 because Monty can not open D1, and only D2 or D3 (one out of two) is available. P(D2|C2) = 0 since Monty can never open D2 if the car is behind the door 2. Since the car really exists behind one of those doors, P(C1) + P(C3) + P(C3) and P(C1|D2) + P(C2|D2) + P(C3|D2) are both unity.

The real-life Monty vs the perfect problem

The motivation for this post is when I read somewhere that Monty Hall did not always open the door in the game show. If that was true, then the TV show presented a different uncertainty than what should’ve been a calculated risk due to probability.

What Monty Must Do Read More »

Endowment Effect

The endowment effect is an emotional attachment to an object in possession whereby the individual asks for a higher value than what they would be willing to pay for it. In other words, an individual’s willingness to accept (WTA) compensation to sell a good exceeds her willingness to pay (WTP) a similar good.

The root of the endowment effect can be similar to status quo bias – the loss aversion.

In the famous experiment carried out by Kahneman et al., students of Simon Fraser University were randomly grouped into three – sellers, buyers and choosers. Sellers were handed coffee mugs that they could sell for prices between $0.25 – $9.25. Buyer groups have the option to buy them at those sets of prices. The people in the chooser group have no mugs but can choose between mugs or that amount of money at the selling prices.

You may notice that the chooser group is equivalent to the seller but without possession of the good, and therefore, the ideal control of the experiment. The results were startling: the average asking price for the sellers was twice ($7.12) than what the chooser ($3.12) and buyer ($2.87) would have settled for.

Kahneman; Knetsch; Thaler, “The Endowment Effect, Loss Aversion, and Status Quo Bias”, Journal of Economic Perspectives, 5(1), 1991

Endowment Effect Read More »

Loss Aversion and Status Quo

Does rational decision-making exist? Well, that depends on how you define it. We have seen the expected value and expected utility theories. The expected value is a straightforward multiplication between the value of an option and its probability to be realised. In this scheme, a 20% chance for $600 (0.2 x $600 = $120) is a clear winner over a sure $100. But we know that is not an automatic choice for people. If one finds more utility for $100, a sure chance is worth more than the possibility of $600; remember, if you are among the lucky 20%, you get $600, not $120. At the same time, a gambler may go for not just %600 but even $400!

These two rules are still not enough to categorise all choices. There is another principle that governs choice, known as the reference-dependent model. i.e. an individual’s preference is dependent on the asset she already possesses. Driven by psychology, a sort of inertia creeps in such situations.

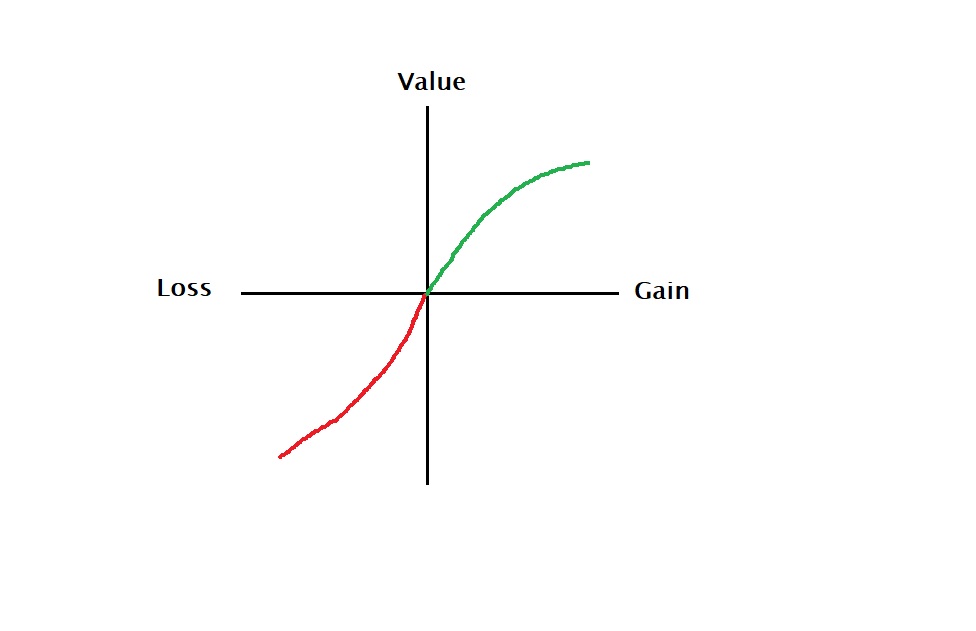
Loss aversion is one such instance. It means that the perceived downside appears heavier than the potential upsides for someone possessing a material (reference point). As a result, you decide to stay where you are – a case of status quo bias. Tversky and Kahneman sketch this value function in the following form.

There is data available from field studies on the choice of medical plans. The researchers found that a new medical scheme is more likely chosen by a new employee than someone hired before that plan was available.

Tversky and Kahneman, “Loss Aversion and Riskless Choice: A Reference Dependent Model,” Quarterly Journal of
Economics, 1991

Loss Aversion and Status Quo Read More »

Biases in Decision Making

Be it massive industrial projects or simple personal decisions – good, quality decisions are essential for success. We have seen the value and utility models helps in understanding how a rational (or real) decision-maker operates.

Biases are one of the big blockers against rational decision making. Let’s see some of the most common types.

Optimism bias

It refers to an individual’s anticipation for positive future outcomes than what could occur in reality. The decision-maker gets the overconfidence that prevents her from thinking about a negative outcome. It is also sometimes called the illusion of invulnerability. While for individuals, this may bring a few benefits (happier life), for critical decision making, say for a business, this is a major cause of alarm. Imagine you launching a product ignoring your competition.

Status quo bias

The preference for the current state of affairs is a type of decision making based on what comes naturally rather than what is important or what the evidence suggests. In politics, conservative ideologies, as their name suggests, favour the status quo, often thwarting progressive changes to society.

Confirmation bias

Confirmation bias ignores contradictory evidence and is desperate to deliver what they are committed to. We all have it to certain degrees, and it is so difficult to get rid of completely.

Sunk cost bias

It happens you continue progressing a project long after you should have abandoned it. And the reason? Well, I have spent a lot already. Call it emotional attachment, overoptimism, or just faith, businesses and individuals throwing good money after bad happens all the time.

Not invented here (NIH) bias

Typical for well-established corporates – hesitance to adopt outsider technologies, and the insistence to develop own, while it is sufficient to replicate existing solutions. A notable exception who reaped rich rewards is Microsoft Corporation.

Anchoring

We have seen anchoring before. This happens when the decision-maker depends heavily on the initial piece of information. Discount sales in shops are a good example. Rather than analysing the merit of that particular (final) price tag, the buyer gets hooked to the anchor, i.e. the original (often inflated) higher price.

Groupthink

It’s about supporting the consensus and ignoring divergent alternatives. Such a tendency could originate from our tendency to harmonise with the rest (especially the superiors), the overconfidence in the judgement of the crowd (argumentum ad populum), or merely the feel of comfort for sharing the blame, in case the decision fails!

The Intelligence Trap

Beware of this automatic assumption that smarter, reactive, quick answers mean an effective thinking process has taken place.

Biases in Decision Making Read More »

Utility and Psychology of Sunk Cost

We have already seen that human decision making is complex and is not always related to the value or the utility of a material (or money). Tversky and Kahneman describe another survey on two groups of people, about 200 people each.

To group #1:
Imagine you paid $10 for a ticket to a play. You reached the theatre and discovered that you had lost the ticket. Will you spend $10 on another ticket?

54% of the people said NO to that question. Apparently, half of the people thought $20 was too expensive for a ticket.

To group #2:
Imagine you went for a play where admission is $10 per ticket. You reached the theatre and discovered that you had lost a $10 bill. Will you spend $10 on a ticket?
88% of the respondents said YES to the purchase.

Same loss, different feelings

The main difference is that, in the second case, the lost dollar was not accounted for the ticket purchase. And $10 on the ticket was a different event unconnected to the loss of $10. I lost a 10 dollar bill due to negligence, but that doesn’t deprive me of watching the play (or it is a good distraction to forget my loss)!.

On the other hand, the re-purchase of the ticket is a painful decision; spending double on a ticket that happened due to my carelessness!

Tversky, A.; Kahneman, D., Science, 1981, 211, 453

Utility and Psychology of Sunk Cost Read More »

The Framing of the Risk in Decision Making

We have seen three questions and the public response to those in the last post. While the expected value theory provides a decent conceptual basis, real-life decisions are typically taken based on risk perception, sometimes collected in the utility functions. Let’s analyse options and the popular answers to the three questions.

80% preference for sure $30 vs 80% chance for $45 is a clear case of risk aversion in all forms. People were willing to ignore that 8 out of 10 would get $45 had they given up the $30 in the bank.

Understanding the response to the second question was easy. The first stage was mandatory for the participants to play, and the options in the second stage were identical to the first question.

The intriguing response was the third one. In reality, the second and third questions are the same. Yet, almost half of people who went for the sure-shot $30 are now willing to bet for $45!

Tversky, A.; Kahneman, D., Science, 1981, 211, 453

The Framing of the Risk in Decision Making Read More »

Utility Model in practice

We have seen how a rational decision-maker may operate using either the expected value or the expected utility theory. Real-life, however, is not so straightforward about these kinds of outcomes. In a famous Tversky-Kahneman experiment, three groups were presented with three situations.

1: Which of the following do you prefer?
A. a sure win of $30
B. 80% chance to win $45

2: There is a two-stage game with a 25% chance to advance to the second stage. After reaching the second, you get the following choices, but you must give the preference before the first stage. If you fail in the first, you get nothing.
C. a sure win of $30
D. 80% chance to win $45

3: Which of the following do you prefer?
E. 25% chance to win $30
F. 20% chance to win $45

Expected Values

We will look at the expected values of each of the options. You will argue that it’s not how people make decisions in real-life. But, keep it as a reference. Remember: EV = value x chance, summed over.

CaseEV
A$30
B$36 ($45 x 0.8)
C$7.5 (0.25 x $30)
D$9 (0.25 x $45 x 0.8)
E$7.5 (0.25 x $30)
F$9 (0.2 x $45)
I have highlighted the higher EVs (of the choices) in bold.

What did people say?

In the first group, 78% of the participants chose option A. In the second, it was 74% in favour of option C. It was almost a tie (42% for E and 58% for F) for the final group.

These three problems are, in one way, similar to each other. We will see that next.

Tversky, A.; Kahneman, D., Science, 1981, 211, 453

Utility Model in practice Read More »

Expected Utility Model

To understand the expected utility theory, you first need to know the expected value theory. Suppose I give you this choice. If there is a 100% chance of getting 100 dollars vs a 20% chance of getting 1000 dollars, which one will you choose?

The expected value (EV), which comes from statistics, is the value multiplied by its respective probability and summed over all possible outcomes. So, for the first choice it is: 100 (dollars) x 1 (sure chance) + 0 (dollars) x 0 (no chance). For the second choice, it is 1000 x 0.2 + 0 x 0.8 = 200. Therefore the expected value of the second is double. So shall I go for the second?

That decision depends on risk and utility

The answer is no more straightforward. EV has given you the limit in terms of statistics, that the second choice yields twice the cash, but your decision follows your risk appetite. It is where the expected utility model comes in. The formula now is slightly different: instead of value, we use utility. So what is utility? The utility is the usefulness of the value.

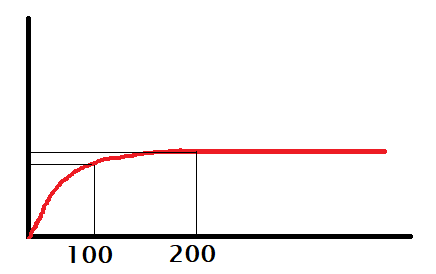
Suppose you badly need 100 dollars, and anything higher is ok but not going to make a difference. Your utility of money might look the following plot.

You may call her someone who desperately needs 100 bucks or a risk-averse person.

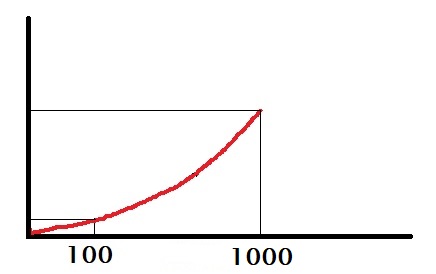
On the other hand, imagine she desperately needs 1000 dollars. In such a case, the person will gamble for 1000 bucks even when the chance of winning is only 20%. She is either a risk-lover or has no use for anything short of 1000.

Expected utility model

The expected utility (EU) of the first and the second choices are respectively:
EU1 = U(100) x 1 + U(0) x 0
EU2 = U(1000) x 0.2 + U(0) x 0

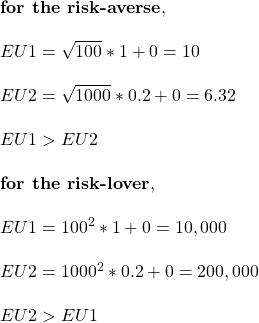
In other words, the utility function depends on the person. Suppose, for a risk-averse, it is a square root, and for a risk-lover, it could be a square. Let’s see what they mean.

\\ \text{\bf{for the risk-averse}}, \\ \\ EU1 = \sqrt{100} * 1 + 0 = 10\\ \\ EU2 = \sqrt{1000} * 0.2 + 0 = 6.32\\ \\ EU1 > EU2 \\ \\ \text{\bf{for the risk-lover}}, \\ \\ EU1 = 100^2 * 1 + 0 = 10,000\\ \\ EU2 = 1000^2 * 0.2 + 0 = 200,000\\ \\  EU2 > EU1

Expected Utility Model Read More »