Life

The Responsibility Bias

It is a commonly observed phenomenon where people claim more credit for their contributions to collecting activities than they deserve. Examples are partners taking more than 50% credits inside marriage relationships, award-winning personalities resisting giving enough credits to their collaborators etc.

The person I see every day

Responsibility bias does not necessarily emerge out of the evilness of an individual. However, it is exacerbated by their ego – too much focus on themselves. Understandably, the quantity of information that a person has on herself is more than what she has on other people. And if she fails to recognise that fundamental disparity, she is expected to make the mistake of shunning others.

Perspective thinking

Noticing and acknowledging the contribution of others requires deliberate effort. One of the techniques is to deliberately consider the members in the group as individuals, not just the ‘rest of the group’.

This is what Caruso and Bazerman at Harvard observed this phenomenon in their investigations on perspective-taking with academic collaborators. They selected articles with three to six authors from five journals, and questionnaires were sent to the writers asking about their experience with the author group.

The questionnaire was divided into 2: 1) self-focused, in which the receivers were asked to write about their contribution (in percentages), and 2) other-focused, in which the subject was first given a task to write down the names of the co-contributors and then about their contributions, including themselves. As a measure, the participants were asked two questions: 1) how much they enjoyed the work and 2) if they were willing to collaborate on a future publication.

As predicted by the investigators, on average, the self-focused group had allocated a higher responsibility to themselves compared to the other-focused.

References

The costs and benefits of undoing egocentric responsibility assessments in groups: Caruso and Bazerman
Give and Take: Adam Grant

The Responsibility Bias Read More »
The Ultimatum Game – The Kahneman Experiment

In yet another Kahneman experiment, the team tried to play the ultimatum game with a group of psychology and business administration students. If you forgot what the game was, here is the description.

The game

Experiment 1

In their experiment, player A got paired with player B at random. There were several pairs. Each duo got $10 that could be divided between the two as proposed by one of the pairs. If player A allocated the division and was acceptable to player B, the payoffs were done accordingly. If the proposed division was unacceptable to player B, neither got anything.

Much to the surprise, because it violated the standard game theory prediction, the researchers found that the majority (75%) of the participants split the offers equally. There were also rejections of some of the proposals.

Experiment 2

The experiment had two parts. The first part was the ultimatum game with a few differences. The subjects only got two possibilities to divide $20: 18:2 or 10:10. And the receiver had no option to reject. In the second part, the participants were matched with two others. She then got a chance to split $12 evenly between herself and the person (the unfair one) who gave away $2 in the previous game (if one of them happened to be in the match) or to split $10 evenly with the even-splitters (the fair ones) of the earlier part.

76% of the people split evenly in the first part of the experiment. In the second part, there was a clear preference (74%) to punish the unfair allocators even when that would mean a $1 cost to the allocator.

The Ultimatum Game – The Kahneman Experiment Read More »

The Ultimatum Game

Adam Grant, in his best-selling book Give and Take, describes the behavioural characteristics of three types of humans based on their attitudes towards other people – takers, matchers and givers. According to the author, takers give away (money, service or information) when the benefits to themselves are far more than the personal costs that come with the transfer. Givers, on the other extreme, relish the value to others more than the personal cost to themselves. Naturally, the matchers are in between – strictly reciprocating.

Grant reference to a paper published by Kahneman et al. in 1986 based on a concept called the ultimatum game, a well-known idea in game theory. Today, we will look at the game. We’ll discuss the study results another day.

The game

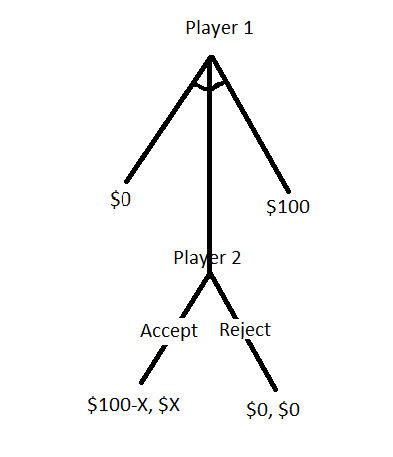
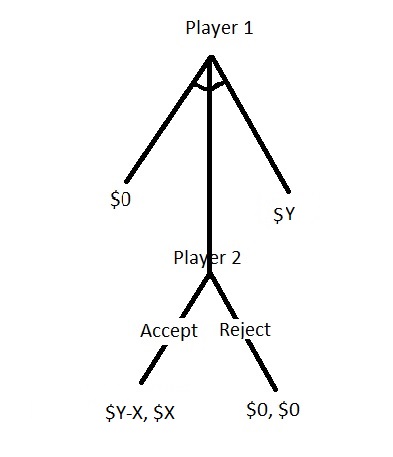
We will illustrate the concept through a 100-dollar game. Player 1 (donor) gets 100 dollars, and she can offer – anything from 0 to 100 – to player 2 (receiver). If player 2 accepts, she gets it, and player 1 takes the rest (100 – X). If player 2 rejects the offer, then no one gets anything.

Rationality vs sense of fairness

If the receiver was rational, her actions would have been governed by her self-interest, as expected by economic theories, and she would have taken whatever was offered. After all, something is better than nothing. But this doesn’t always happen. There is a limit to the offer below which the receiver may feel the donor’s injustice.

Further Reading

Give and Take: Adam Grant
Ultimatum Games: William Spaniel

The Ultimatum Game Read More »

Newcomb’s Paradox

The paradox was created by William Newcomb and was first published by Robert Nozick in 1969.

Imagine there is a being that has the superpower to predict your choices with high accuracy, and you know that. There are two boxes, B1 and B2. You know that B1 contains 1000 dollars and B2 carries either one million dollars or nothing. You have two choices: 1) take what is inside both the boxes or 2) only take what is in the box B. Further, it is a common knowledge that:
1) If the being predicts that you will take both the boxes, it will not add anything to box B
2) If the being knows you will only take box B, it will add a million dollars to it.

I guess you remember the definition of common knowledge: you know that he knows that you know stuff!

What will you choose?

There are two possible arguments for leading to two different decisions.
1) You know the being will read your mind and put nothing in B if you choose both the boxes and add a million if only B is chosen. So select option 2 (select box B).
2) The being has already made the decision (after reading your mind), and the only way for you to minimise the damage is to select option 1 (select both the boxes).

In polls conducted to understand their preferences, people often tied at 50:50; there are takers for both options. But why is that?

Dominance principle

Let’s first write down the payoff matrix.

The Being
predicts
you take B
The Being
predicts
you take both
You take Box B1 million0
You take both1 million +
1000
1000

The dominance principle states that if you have a strategy that is always better, you make a rational decision to choose that. In this case, that is taking both boxes.

Here is a thought experiment to explain this perspective. Imagine the other side of the box is transparent, and your friend is standing on that side. She can see the amount inside. Although she can’t tell you anything, what would she be hoping for? Well, if she sees that the being had put a million in box B, you would be better off taking that box and the one that carries 1000. If She finds the being did not add anything, she would still like you to take both the boxes to win the guaranteed 1000.

Expected value theory

While the expected utility theory is better suited to describe situations like these, I have gone for the expected value theory as I find it easier to explain things. We estimate the expected value of each action by multiplying the value by its probability. Imagine you trust the being is accurate at 90%, the following two calculations get you the value of your decision, and you choose what gives the highest.

You take B0.9 x 1,000,000 + 0.1 x 0
= 900,000
You take both0.9 x 1000 + 0.1 x 1,001,000
= 101,000

Therefore, you select only box B.

Newcomb’s Problem and Two Principles of Choice: Robert Nozick
Newcomb’s Paradox – What Would You Choose?: Smart by Design

Newcomb’s Paradox Read More »

Ambiguity Aversion

Ellsberg and Allais paradoxes have one thing in common – both reflect our ambiguity aversion. Given the opportunity to choose between a ‘sure thing’ and an uncertain one, people tend to pick the former. Or it is the behaviour characteristics that dictate your decision-making when the probability of the outcome is known vs it is unknown; a feeling that tells you an uncertain outcome is a negative outcome.

In the case of the Ellsberg paradox, people are happy to bet on the red ball when they know the risk (33% chance) against the ambiguity surrounding the black and yellow. The same people had no issue dumping the mathematically identical option (red) when they knew there was a 60% chance of getting 100 if they went for one of the others.

In the case of the Allais, it was a fear imposed by a 1% chance of getting nothing. If you want to know that fear, let’s take the case of a vaccine that can give a 10% chance of 5-year protection, 89% chance of 1-year protection and a 1% chance of no protection, or worse, a 1 in a million probability of death! If that was placed side by side with another one that guarantees 1-year protection to all, without any known side effects, guess what I would go for.

Ambiguity Aversion Read More »

Allais Paradox

You have two choices: A) A lottery that guarantees $ 1 M vs B) where you have a 10% chance of winning $ 5M, 89% chance for 1 M and 1% chance of nothing. Which one will you choose? If I write them in a different format:

A$ 1M (1)
B$ 5M (0.1); $ 1M (0.89); $ 0 (0.01)

Having chosen one of the above two, you have another one to choose from. C) A lottery with an 11% chance of $ 1 M and 89% chance of nothing vs D) a 10% chance of winning $ 5M, 90% chance of nothing.

C$ 1M (0.11); $ 0M (0.89)
D$ 5M (0.1); $ 0 (0.9)

Allais (1953) argued that most people preferred A and D. What is wrong with that?

Expected Value

If the person had followed the expected value theory, she could have chosen B and D:

A) $ 1M x 1 = $ 1M
B) $ 5M x 0.1 + $ 1M x 0.89 + $ 0 x 0.01 = $ 1.39 M
C) $ 1M x 0.11 + $ 0M x 0.89 = $ 0.11 M
D) $ 5M x 0.1 + $ 0 x 0.9 = $ 0.5 M

Expected Utility

Since the person chose A over B, clearly, it was not the expected value but an expected utility that governed her. Mathematically,

U($ 1 M) > U($ 5 M) x 0.1 + U($ 1 M) x 0.89 + U($ 0M) x 0.01

Now, collect the U($ 1 M) on one side, add U($ 0M) x 0.89 on both sides, and simplify.

U($ 1 M) – U($ 1 M) x 0.89 > U($ 5 M) x 0.1 + U($ 0M) x 0.01
U($ 1 M) x 0.11 > U($ 5 M) x 0.1 + U($ 0M) x 0.01
U($ 1 M) x 0.11 + U($ 0M) x 0.89 > U($ 5 M) x 0.1 + U($ 0M) x 0.01 + U($ 0M) x 0.89
U($ 1 M) x 0.11 + U($ 0M) x 0.89 > U($ 5 M) x 0.1 + U($ 0M) x 0.9

Pay attention to the last equation. What are you seeing here? The term on the left side is the expected utility equation corresponding to option C, and the one on the right side is option D. In other words, if A > B, then C > D. But that was violated in the present case.

Allais Paradox Read More »

Ellsberg Paradox

Imagine an urn containing 90 balls: 30 red balls and the rest (60) black and yellow balls; we don’t know how many are black or yellow. You can draw one ball at random. You can bet on a red or a black for $100. Which one do you prefer?

RedBlackYellow
A$100$0$0
B$0$100$0

Ellsberg found that people frequently preferred option A.

Now, a different set of choices: C) you can bet on red or yellow vs D) bet on black or yellow.

RedBlackYellow
C$100$0$100
D$0$100$100

Most people preferred D.

Why is it irrational?

If you compare options A and B, you can ignore the column yellow because they are the same. The same is the case for C vs D (ignore yellow as they offer equal amounts). In other words – if you had preferred A, logic would suggest you choose C and not D.

RedBlack
A$100$0
B$0$100
C$100$0
D$0$100
A = C; B = D

The second way is to look at it probabilistically. If you chose option A, you are implicitly telling that the probability of Red is more than the probability of Black. If that is the case, in the second exercise, the probability of Red or Yellow has to be greater than the probability of Black or Yellow. But you violated the law with your preference.

Decision under uncertainty

Clearly, the decision was not made based on probability or expected values. What is common for B and C is the perception of ambiguity. In the case of A, there is no 30% guarantee for a Red. In the case of D, there is a 60% guarantee to win $100.

Ellsberg Paradox Read More »

Detox and Cleansers

The significance of detox is not just about spreading myths or exploiting human phobias; it’s also about the multi-billion dollar industry that thrives on our ignorance. But before we examine why it is pointless to try and clean your body by consuming something or doing some breathing exercise, let us first understand why ideas that flush out stuff from the body are sold so readily.

Easy to relate

It is easy to visualise accumulated dirt and the attack of enemies. If you have blocked drainage, you send liquid cleaners down. If the enemy attacks, send soldiers and smoke them out. It is a fallacy called the false analogy. Another one is the appeal to (common) belief. So, when your trusted traditional healer asks you to drink plenty of water and then vomit them out, you feel assured and feel happy after spitting out the bitter (must be the bad stuff in the body!) liquid.

Your real cleaner

Part of the reason we readily buy the plumbing argument is our lack of knowledge about our bodies. The liver is a vital organ in our body that, among scores of other things, is the gatekeeper against harmful substances. It breaks down the food we consume and sends the good stuff to the bloodstream and the waste to the kidneys.

Now, think about what happens when you drink your favourite detox drink, which contains a couple of vegetables, perhaps a lemon and a few herbs. It gets digested, nutrients are absorbed in the blood, and they reach the liver. Alas, not knowing this was a cleaner meant to clean it up, the liver breaks them down and packs any valuable things, e.g. vitamins, into the body and the waste to the kidneys.

What can you do for your cleaner?

The least you can do is not to overwhelm it. Avoiding the overconsumption of alcohol tops the list. Get vaccinated against Hepatitis (B and C), the viral infection that affects the liver. Finally, be careful with detox agents, especially the overload of unknown natural stuff, which often damages your liver or kidneys.

Read

Detoxing body: The Guardian

The water myth: McGill

Detox deception: The nature education

Body stuff with Dr Jen Gunter: TED

4 detox myths: MD Anderson

Detox and Cleansers Read More »

Origins of the Black Death

We have been seeing some marvellous acts of bio-detectives in recent years. In yet another monumental feat of locating the proverbial needle in the haystack, scientists of the Eberhard Karls University of Tübingen have unearthed the origins of the bubonic plague of the mid-14th century.

In a paper published yesterday in the prestigious journal Nature, Spyrou et al. describe how DNA sequences of samples from seven individuals exhumed from two of the cemeteries in Kara-Djigach and Burana of the modern-day Kyrgistan.

The team collected the tooth samples from Peter the Great Museum of Anthropology and Ethnography in St Petersburg. The specimens were excavated between 1885 and 1892. The tombstone inscriptions suggest that the victims were dead between 1338 and 1339. DNA extractions were done from the tooth powder using standard extraction reagents, and voila: they see DNA sections of Yersinia pestis (Y. pestis), the bacterium responsible for killing about 60% of the population of western Eurasia!

What is more? The study identified the DNA as the common ancestor to the bacteria strains that ran havoc in central Eurasia.

The source of the Black Death in fourteenth-century central Eurasia: Nature

Origins of the Black Death Read More »

Ecological Fallacy – What Radelet Saw

Michael Radelet’s study in 1981 is an example of ecological fallacy but, more importantly, exposed the racial disparity that existed in the process of ensuring criminal justice in the US.

Radelet collected data from 20 counties of Florida indictments of murders that occurred in 1976 and 1977. His research team have identified 788 homicide cases, and after cleanup of incomplete information, 637 remained for further investigation.

Ecology

Let us start with the overall results: the race composition of the death penalty is 5.1% (17 death penalties out of a total of 335 defendants) for blacks and 7.3% (22 out of 302). There is nothing much in it, or if you are right-leaning with a bit of vested interest, you might even say the judges are more likely to hand death penalties to the whites!

The details

Now, what happens to justice if the victims were white? If the person died in the case was white, there is a 16.7% chance for the black defendants to get a death sentence vs 7.7% for a white. On the other hand, if the person murdered was back, the percentages are 2.2 for blacks and 0 for whites. Black lives were priced lower, and whites seemed to have some birth rights to take out some of it!

The complete dataset is below; you may do the math yourself.

# CasesFirst degree
indictments
Sentenced
to Death
Non-Primary
White victim
Black defendant635811
White defendant15112419
Non-Primary
Black victim
Black defendant103566
White defendant940
Primary
White victim
Black defendant310
White defendant134733
Primary
Black victim
Black defendant166510
White defendant840
Total63737139

Radelet, M.L.; Racial Characteristics and the Imposition of the Death Penalty, American Sociological Review, 1981, 46 (6), 918-927

Ecological Fallacy – What Radelet Saw Read More »