Life

The weatherman is Always Wrong

It is easy to prove your weatherman is wrong. Easier if you are short-term memory and are oblivious to probability.

Imagine you tune into your favourite weather program; the prediction was: a 10% chance of rain today. You know what it means: almost a dry day ahead. The same advice continued for the next ten days. What is the chance there was rain on at least one of those days? The answer is not one in ten, but two in three!

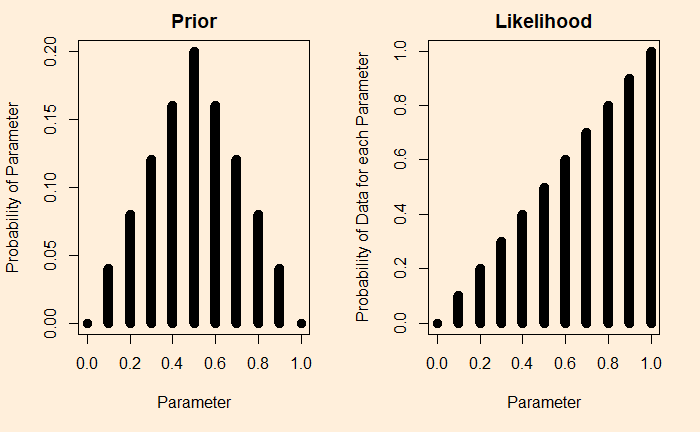
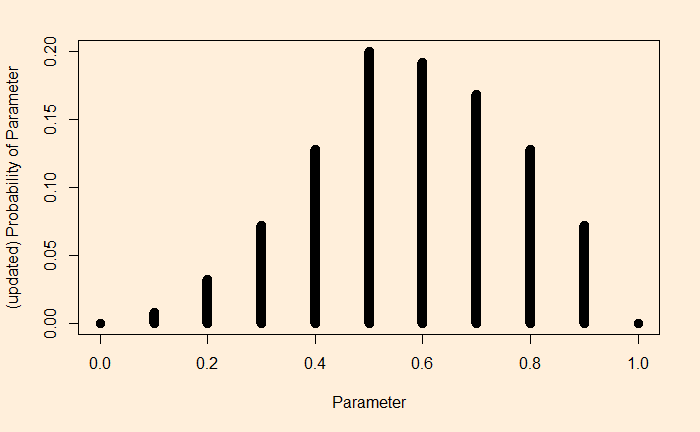
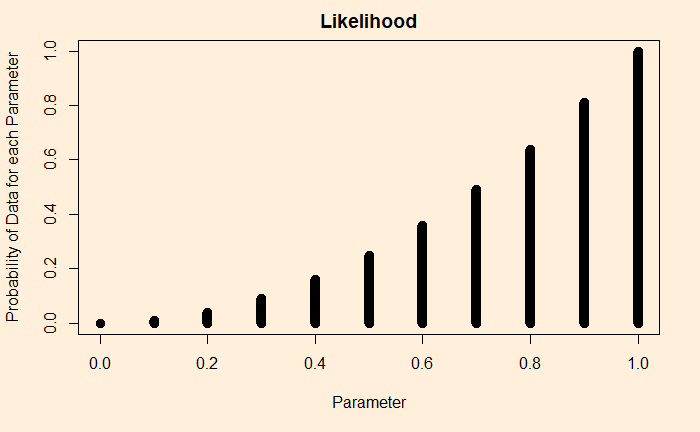
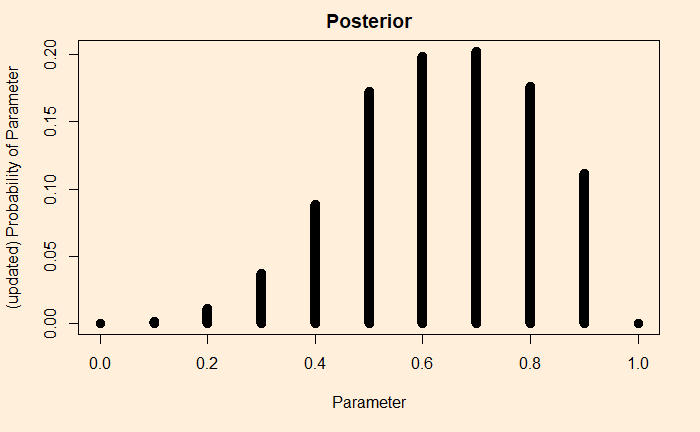
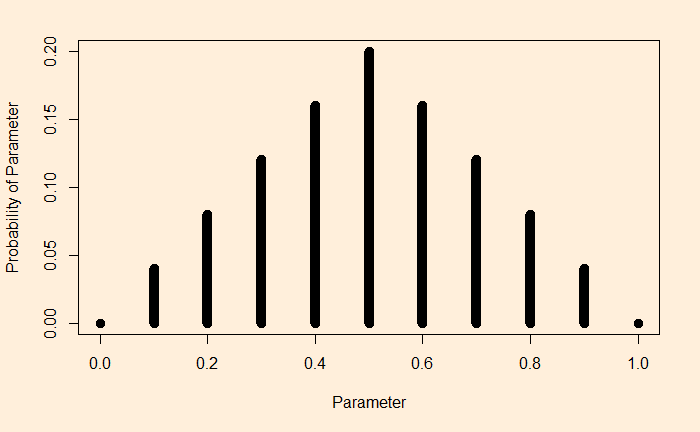
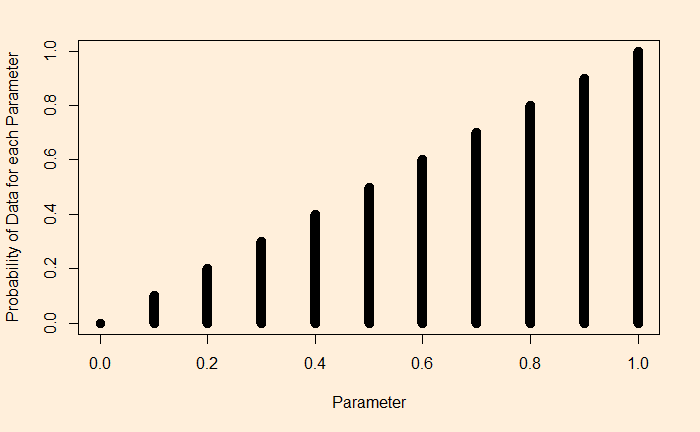
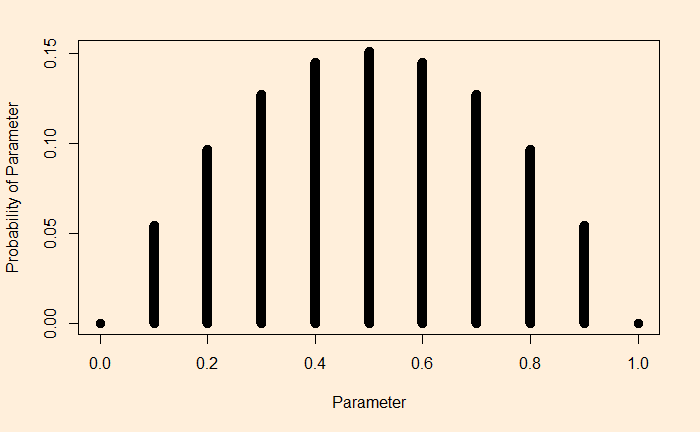
You can’t get the answer by guessing or using common sense. You must know how to evaluate the binomial probability. For instance, to calculate the chance of getting at least one rain in the next ten days, you use the formula and subtract it from one.

Decision making

All these are nice, but how does this forecast affect my decision-making? The decision (take a rain cover or an umbrella) depends on the threats and alternate choices. On a day with a 10% chance of rain predicted, I will need a reason to take an umbrella, whereas, on a day of 90%, I need a stronger one not to take precautions.

Why the weatherman is wrong

Well, she is not wrong with her predictions. But the issue lies with us. Out of those tens days, we may remember only the day it rained because it contradicted her forecast of 10%. And the story will spread.

The weatherman is Always Wrong Read More »

Arriving at the Conditional Probabilities

We have seen the concepts of joint and conditional probabilities as mathematical expressions. Today, we discuss an approach to understanding the concepts using something familiar to us – using tables.

Tabular power

Tables are a common but powerful way of summarising data. Following is one summary from a hypothetical sample collection of salary ranges of five professionals.

It is intuitive for you to know that the values inside the table are the joint occurrences of the row attributes (professions) and column attributes (salary brackets). You get something similar to a probability once you divide these numbers by the total number of samples (= 1000). In other words, the values inside the table give us the joint probabilities.

Can you spot the marginal probabilities, say, that of doctors in that sample space? Add the numbers of the rows or columns; you get it.

Conditional probabilities

What are the chances it is a doctor if the salary bracket is 100-150k per annum? You only need to look at the column for 100-150k (because that was given) and then calculate the proportion of doctors in it. That is 0.005 out of 0.125 or 0.005/0.125 = 0.04 or 4%.

Look it this way: in the sample space, were 125 people in the given salary bracket, of which five were doctors. If the sample holds it for the population, the percentage becomes 5/125 or 4%.

The calculation can also work in the other way. What is the probability of someone in the salary bracket of 200-350k per year, given the person is a doctor? Work out the math, and you get 76%.

Arriving at the Conditional Probabilities Read More »

Bias in a Coin – Continued

A quick recap: in the previous post, we set a target of finding the bias of a coin by flipping it and collecting data. We have assumed a prior probability for the coin bias. Then established a likelihood for a coin that showed a head on a single flip.

We know we can multiply prior with the likelihood and then divide by the probability of the data.

P(\theta|D) = P(D|\theta) * P(\theta) / P(D)

The outcome (posterior) is below.

Look at the prior and then the posterior. You see how one outcome (heads on one flip) makes a noticeable shift to the right. It is no more equally distributed to the left and the right.

What would happen if, for the same prior, but getting two heads? First, calculate the likelihood:

You can see a clear difference here as the appearances of the two heads changed the likelihood heavily to the right. The same goes for the updated chance (the posterior).

Bias in a Coin – Continued Read More »

Bias in a Coin

Bayesian inference is a statistical technique to update the probability of a hypothesis using available data with the help of Bayes’ theorem. A long and complicated sentence! We will try to simplify this using an example – finding the bias of a coin.

Let’s first define a few terms. The bias of a coin is the chance of getting the required outcome; in our case, it’s the head. Therefore, for a fair coin, the bias = 0.5. So the objective of experiments is to toss coins and collect the outcomes (denoted by gamma). For simplicity, we give one for every head and zero for every tail.

\gamma = 1 \text{ for head and } \gamma = 0 \text{ for tail}

The next term is the parameter (theta). While the outcomes are only two – head or tail, their tendency to appear can reside on a range of parameters between zero and 1. As we have seen before, theta = 0.5 represents the state of the unbiased coin.

The objective of Bayesian inference is to estimate the parameter or the density distribution of the parameters using data and starting guesses. For example:

In this picture, you can see an assumed probability distribution of coins made from a factory. In a way, this is to say that the factory produces ranges of coins; we think the highest probability to be theta = 0.5, the perfect unbiased coin, although all sorts of other imperfections are possible (theta < 0.5 for tail-biased and theta > 0.5 for head-biased).

The model

It is the mathematical expression for the likelihood function for every possible parameter. For coin tosses, we know we can use the Bernoulli distribution.

P(\gamma|\theta) = \theta^\gamma (1-\theta)^{(1-\gamma)}

If you toss a number of coins, the probability of the set of outcomes becomes:

\\ P({\gamma_i}|\theta) = \Pi_i P(\gamma_i|\theta) =  \Pi_i \theta^{\gamma_i} (1-\theta)^{(1-\gamma_i)} \\ \\ = \theta^{\Sigma_i\gamma_i} (1-\theta)^{\Sigma_i(1-\gamma_i)} = \theta^{\#heads} (1-\theta)^{\#tails}

Suppose we flip a coin and get heads. We substitute gamma = 1 for each of the theta values. A plot of this function for the following type appears:

Let’s spend some time understanding this plot. The plot says: if I have a theta = 1, that is a 100% head-biased coin, the likelihood of getting a head on a coin flip is 1. If it is 0.9, then 0.9 etc., until you reach a tail-biased one at theta = 0.

Imagine, I did two flips and got a head and a tail:

The interpretation is straightforward. To take the extreme left point: If it was a tail-biased coin (the parameter, theta = 0), the probability of getting one head and one tail is extremely low. Same for the extreme right (the head-biased).

Posterior from prior and likelihood

We have prior assumptions and the data. We are ready to use Bayes’ rule to get the posterior.

Bias in a Coin Read More »

Health Screening and Some Biases

This is not a post against health screening. In fact, I did my annual checkup yesterday, something I’ve been maintaining since my 30s. Today, we critically examine a few potential challenges associated with the much-advertised benefits of cancer screening.

Survival rates

The most common metric of reporting is the survival rate. It’s the percentage population who are diagnosed with an illness that survives a particular period. Based on the local system, these periods maybe five years, ten years etc.

A long-term (2019-2013) study of prostate cancer from a French administrative entity was reported by Bellier et al. The results show the following features. The incident rate remained almost flat at around 850 per 100,000 from 1991 to 2003 for people aged 75 and over. Then the rate started decreasing at an annual rate of 7%. For the men aged 60-74, 1991 to 2005 showed a steady increase followed by a decrease similar to the older age. Overall, the younger group (60-74) had a higher 8-year survival rate (as high as 95%).

Lead time bias

Illnesses such as cancers have a particular pre-clinical phase, the time lag between the onset of disease and the appearance of symptoms. A screening test can catch the disease at this stage. The longer the pre-clinical phase, the higher the likelihood of catching early by testing. This creates a lead time in comparison with the untested. Even if the ultimate year of death is the same, the lead time adds to the statistics giving a false impression of survival rates.

Overdiagnosis

Overdiagnosis is the detection of an illness that would not have resulted in symptoms and death. As the screening rate increases, followed by treatment of the positives, it becomes difficult to know how many of them benefitted from the treatment.

Confounding

Confounding also comes to complicate the analysis. In the last few decades, along with advancements in diagnostic techniques, cancer treatments have also improved significantly, leading to higher survival chances for the early and late-diagnosed population. It makes the separation of benefits of early diagnosis less apparent.

Health Screening and Some Biases Read More »

Hormonal contraception and thrombosis

Studies have found that the usage of hormonal contraceptives increases the chances of thrombosis by 300 to 500 per cent. Isn’t it worrying? Definitely, it is worrying, but what is the absolute risk here?

Breaking news of the 60s

The association between certain types of oral contraceptives (that contain estrogen and progestin) with thrombosis has been known since the 1960s. Naturally, it led to attention from the media and panic in society, eventually to reduced usage and increased pregnancies.

A case of bad science reporting?

Hopefully, you have recognised the main issue with this report (remember the posts about covid vaccines and colorectal cancer.). A paper published in 2011 reviewed this case of thrombosis with root causes and relative risks. Among them was the absolute risk or the incidence of thrombosis for adults. It is 1 -10 per 100,000 per year. With the use of this type of oral contraceptive, the risk increase to 5 – 50 in 100,000 per year, which is up to 0.05%. But what about mishaps due to actual pregnancies and abortions? 

Finally, just how big is a 100% increase of a risk? Well, that depends on the absolute risk on which it is based!

Hormonal Contraception and Thrombotic Risk: A Multidisciplinary Approach: PEDIATRICS, 127(2), 2011

Hormonal contraception and thrombosis Read More »

Self-Estimated Intelligence

We have seen self-assessment bias before. Self-assessment of intelligence falls closer to this. Many studies have shown this bias affects men and women differently. And this led to the term MHFH or Male Hubris, Female Humility in cognitive psychology. Note that this exists despite countless studies which failed to find any difference in the levels of general intelligence between men and women.

Apart from these so-called Dunning–Kruger effects, cultural stereotypes play a role in this gender bias. For example, there are study results in which the participants rated their fathers as more intelligent than mothers. Asking parents about their children also resulted in similar impressions. You add teachers, media, or the society as a whole, to this mix; the disaster is complete.

Higher self-esteem is also seen as a contributing factor to higher self-estimations. And gender, as a sex or a personality trait, masculine vs feminine, has a role in this.

Self-Estimated Intelligence Read More »

The curse of the VAERS: The Post Hoc Fallacy

Today we explore the difference between ‘after’ and ‘from’! Because it concerns a famous fallacy called “Post Hoc Ergo Propter Hoc“. So what does this cool-sounding Latin phrase mean? As per Wikipedia, it means: “after this, therefore because of this”. It is the interpretation that something happens after an event to something from it. Take the example of the CDC’s Vaccine Adverse Event Reporting System (VAERS).

Adverse Event Reporting System

The Centers for Disease Control and Prevention of the United States uses VAERS as a system to monitor adverse events following vaccination. The data was meant for the medical researchers to find patterns and, thereby, potential impacts of vaccines on human health. Naturally, the system gets scores of events ranging from minor health effects to deaths. And a section of the crowd interprets and propagates these events due to vaccination. So, where is the fallacy here?

What happened in 2020

The number of people who died in the US due to heart disease in 2020 is 696,962, which is about 2000 per million population. The figure is 1800 for cancer, 500 for respiratory illness and 310 for diabetes. So, roughly 4610 per million per year due to these four types of diseases.

Thought experiment

Let’s divide 20 million Americans into two hypothetical groups of 10 million each. The first group took the vaccine over one month, and the second did not. What is the expected number of people from the unvaccinated group to die of the four causes mentioned previously? About 3840. But they do not report to the VAERS.

On the other hand, imagine a similar death rate to the vaccinated group. If 10% of those 3840 people report the incident in the system, it will make 384 reports or about 4600 in the whole year.

The first case will be forgotten as fate, whereas the second will be celebrated by the media as: “vaccine kills thousands”!

References

Diseases and Conditions: CDC

Vaccine Adverse Event Reporting System (VAERS): CDC

The curse of the VAERS: The Post Hoc Fallacy Read More »

Probabilistic Insurance

Probabilistic insurance is a concept introduced by Kahneman and Tversky in their 1979 paper on prospect theory. Here is how it works.

You want to insure a property against damage. After inspecting the premium, you find it difficult to decide to pay for the insurance or leave the property uninsured. Now, you get an offer for a different product that has the following feature:

You spend half the premium but buy probabilistic insurance. In this case, you have a probability p, e.g. 50%, in which you, in case of damage, will pay the rest of the 50% and get fully covered, or the premium is reimbursed, and the damage goes uncovered.

For example, the scheme works in the first mode (pay the reminder and full coverage) on odd days of the month and the second mode (reimbursement and no coverage) on even days!

Intuitively unattractive

When Kahneman and Tversky asked this question to the students of Standford university, an overwhelming majority (80%) was against the insurance. People found it too tricky to leave insurance to luck or chances. But in reality, most insurances are probabilistic, whether you are aware or not. The insurer always leaves certain types of damages outside their scope. The investigators proved using the expected utility theory that probabilistic insurance is more valuable than a regular one.

Tversky, A.; Kahneman, D., Econometrica, 1979, 47(2), 263

Probabilistic Insurance Read More »

Randomness and Doctrine of Signature

Take a carrot, cut a slice, and look closely. Does it resemble your eyes? See what I meant; it provides the nutrient that is good for the eyes. Have you ever wondered why the tomatoes cut through the middle appear like your heart? Do you know that the polyunsaturated fats of walnut boost your brain? Don’t you know kidney beans are the best thing for your kidney?

The seed for the brain

Start with Mr Walnut. Here is what it looks like:

walnut, nut, shell-3072652.jpg

So naturally, it should be related to the brain. Isn’t it? Well, let me search: yes, it has polyunsaturated fats that are good for the brain! Well, that can also be good for the heart. But that is not the point. And it does not resemble my heart. What about sunflower seeds, flax seeds or flax oil, and fish, such as salmon, mackerel, herring, albacore tuna, trout, corn oil, soybean oil, and safflower oil. They all can give you similar nutrients. But they don’t look like a brain. So, let walnut be the brand ambassador of my brain. Why not? By the way, Cahoon et al. searched the literature but could not find any strong association between walnut and cognitive power. Maybe, they did not search deep enough!

Carrot for your eyes

Cut a carrot and see if it appears like your eyes.

carrot, leek, healthy-1256008.jpg

No? If not, cut it until you see some part that resembles your eyes. Come on; you can do it. But what about these: tomatoes, red bell pepper, cantaloupe, mango, beef liver, and fish oils. They, too, contain vitamin A. So what?

Vitamin A is not going to give you night vision. But it should be part of your diet as it helps manage your health, including eye health. Also, carrot doesn’t come packed with vitamin A. But it contains its precursor beta carotene.

Kidney beans

beans, legumes, food-1001032.jpg

What is the difference between kidney beans and other lentils? Or between blueberries, seabass, egg white, garlic, olive oil, bell peppers, and onions? Well, the key difference is that except for kidney beans, none of the others resembles my kidneys. So, even if they are better food for kidneys than these beans, I am not interested in them.

What about eating jelly beans? Something to research on.

Where do these come from?

Human beings are masters of finding patterns around them and making up stories to support their imagination. The doctrine of signature, too, belongs to that category. It is also a favourite for the creationist folks. Why else is that food created with the shape of your organ? There must be a purpose.

Walnut intake, cognitive outcomes and risk factors: a systematic review and meta-analysis: Pubmed

Cooking Legumes: A Way for Their Inclusion in the Renal Patient Diet: Pubmed

Randomness and Doctrine of Signature Read More »