Life

Risk Preferences

We will use utility curves to illustrate three different kinds of risk preferences. They are:

Risk-averse

Here is a person who has the diminishing utility of marginal wealth. I.e., the extra dollar additional income from 10,000 to 10,001 brings a lesser increase in happiness to her than going from 100 to 101.

Notice the probabilistic (expected) utility line (blue) is below the certainty (brown).

Risk neutral

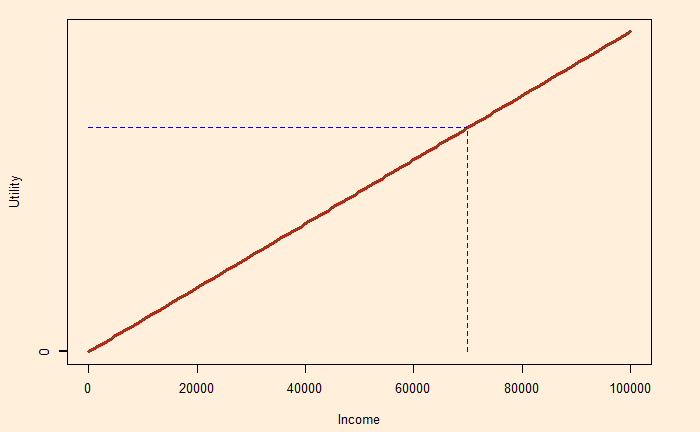
This person shows constant marginal utility. The person has the same happiness with a 1 dollar salary rise whether her current is at 10,000 or 100,000.

Risk lover

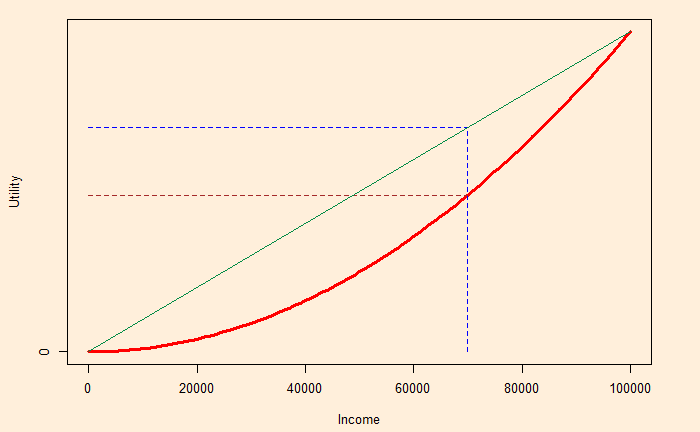
Imagine someone needs 100,000 for a major surgery to save her life. Smaller numbers don’t make much sense to her, and she is willing to gamble for a larger prize. She has increasing marginal utility.

Unsurprisingly, the expected utility line (blue) is above the certainty (brown).

Risk Preferences Read More »

Pascal’s Wager

Think about this game. There is a 1 in 1000 chance of winning a prize of 1 billion. The price of the ticket is $1. Will you take the gamble? Definitely, it is a good deal to buy the ticket. You only lose a dollar but get a chance to win a billion (expected value of a million).

Pascal used a similar argument to state that belief in god was a better deal than not doing so. He argues:
Proposition 1: God exists
Proposition 2: God doesn’t exist
If god exists and you believe, the payoff is infinitely good
If god exists and you don’t believe, the payoff is much worse
On the other hand, if god doesn’t exist, regardless of whether you believe in it or not, the payoffs (positive and negative) are finite. So, he argues, believing is a better deal.

God exists (G)God
does not exist (¬G)
Belief (B)infinite gainfinite loss
Disbelief (¬B)infinite lossfinite gain

Based on the payoff matrix, there is only one rational (!) decision: choose B.

Pascal’s wager: Wiki
PHILOSOPHY – Religion: Pascal’s Wager: Wireless Philosophy

Pascal’s Wager Read More »

The Probability of Steroid Team

A country has two teams of weightlifters; in one, 80% use steroids regularly, and in the other, only 20% use them. The head coach flips a coin and selects the team for the international meet. At the venue, if one lifter was selected at random for the drug test and found positive, what is the probability that the team is the steroid one?

We will use the base form of Bayes’ theorem – the relationship between conditional and joint probabilities.

P(S/T) = P(S & T) / P(T)
S – it is a steroid team
T – tested member used steroid
C – it is a clean team

P(S & T) = P(S) x P(T|S) = 0.5 (coin toss) x 0.8 (chance of using steroids, given he is from the steroid team) = 0.4
P(T) = P(S) x P(T|S) + P(C) x P(T|C) = 0.5 x 0.8 + 0.5 x 0.2 = 0.5
P(S/T) = 0.4/0.5 = 0.8

The probability that the team is the steroid one is 80%

The Probability of Steroid Team Read More »

Risk Aversion and Insurance

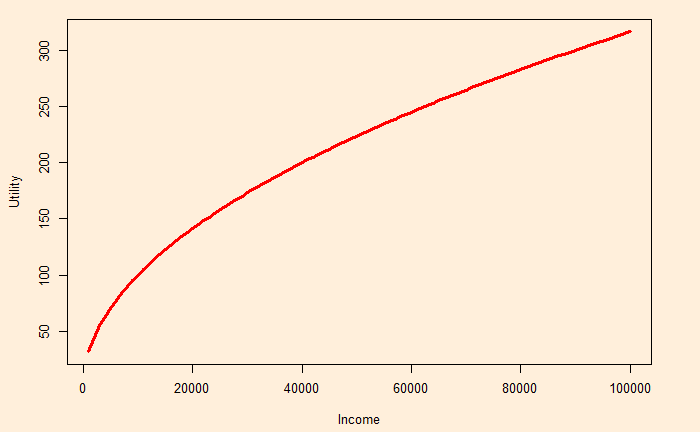
We have seen how risk-averse and risk-taking behave differently given options to take a certain $70,000 or a gamble with a 70% chance of winning $100,000. The former will take $70,000, and the latter will try the luck of winning $100,000. Remember, the expected value of both choices remains the same – $70,000. We have also seen that the utility of that money increases as the square root of the income (decreasing utility rate).

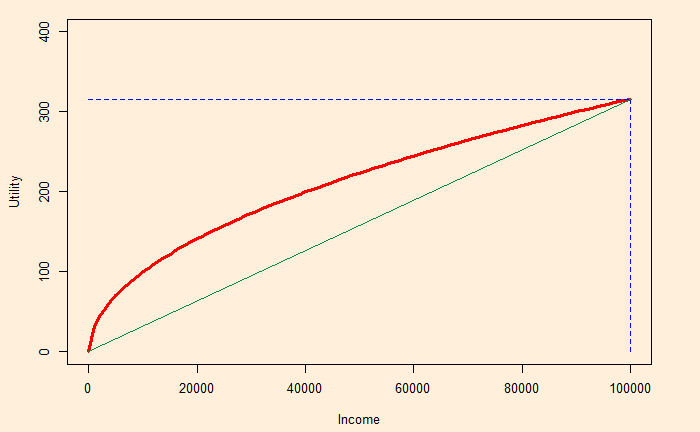
Also, using this example, we will work out the value of guarantees (insurance) for the risk-averse. The utility of the expected value is graphically represented as:

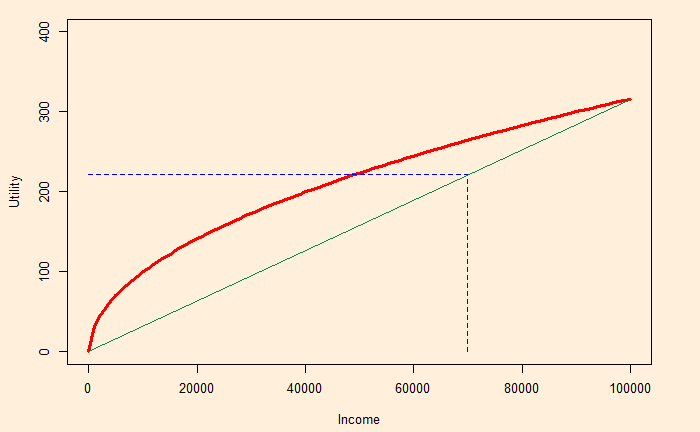
The vertical line touches the X-axis at 0.7 x 100,000 = 70,000, and the expected utility (not the guaranteed) is where the horizontal line touches the Y-axis. We have estimated this value in the previous post as 221.36.

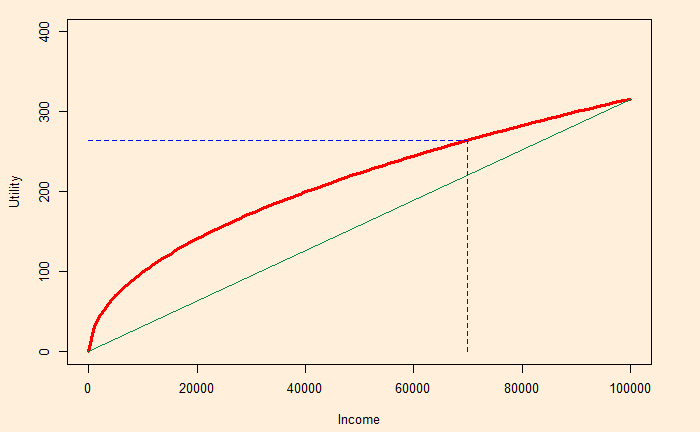
When the income is guaranteed (at 70,000), the corresponding utility becomes:

This guaranteed utility is 264.58, which the risk-averse is perfectly happy to accept. Note that the risk-lover is aiming for the full utility. (Although, in the process, she might end up with nothing!)

Insurance

The insurer can guarantee $70,000 at a fee. It is because, whereas it may have to give the individual $70,000, the insurance company knows that if several people gamble, at the end of the day, they will get $70,000. In other words, the expected value exists for the entity that oversees hundreds of gambles and not for the individual who only sees 0 or 100,000. And the fees become the profit for the company.

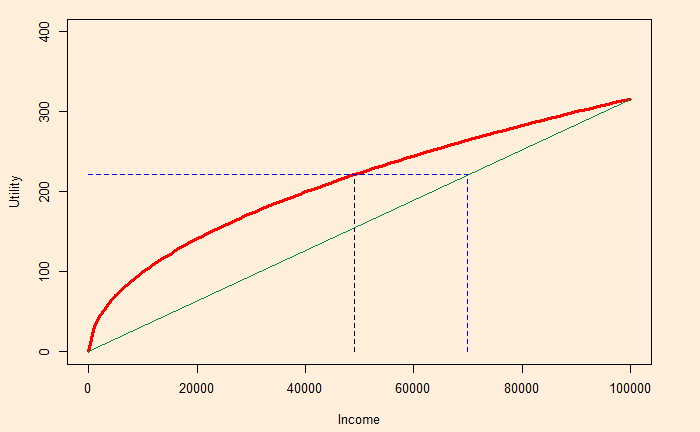
Look at how much income the gamble is worth (with certainty). It is the point at which the black dotted line hits the X-axis in the representation below:

It is about 49,000 in our example. The insurer absorbs it and promises 70,000. The individual and insurer may split the difference (70,000 – 49,000 = 21,000). Say, in one case, the insurer charges 5,000 as the fee, leaving the person with 65,000, equivalent to a utility of $253.

Risk Aversion and Insurance Read More »

Insurance and Risk

Let’s go one step further in the expected utility story. Here, we use the same utility function, I1/2, but a different probability of success. This time, the gamble has a 70% chance to get 100,000 vs. 30% chance to lose everything. The expected value is
0.7 x 100,000 + 0.3 x 0 = 70,000

The expected utility is:
0.7 x(100,000)1/2 + 0.3 x 0 = 221.36

Imagine someone guarantees the expected value (70,000). The utility of this amount is:
70,0001/2 = 264.58

Surely, the second person, who is guaranteed the value, is happier. In other words, the risk is removed, or certainty is added in the second case. So, the question is: what is the price of that ‘insurance’?

Insurance and Risk Read More »

Maximum Willingness to Pay for Insurance

We have seen what expected utility is and how it’s different from the expected value. Suppose Amanda earns 100,000 dollars a year and has a 1% chance of getting sick. The cost of sickness is 50,000 dollars (on medical bills). Amanda’s utility function is:

U = I1/2; where I is the income.

What is her maximum willingness to pay for insurance that covers 50,000 dollars in medical bills?

The maximum willingness to pay is the price, at which she is indifferent between buying the insurance and not. Therefore,

Expected utility with insurance = Expected utility without insurance.
(100,000 – P)1/2 = 0.99 x (100,000)1/2 + 0.01 x (100,000 – 50,000)1/2
P = 100,000 – [(0.99 x (100,000)1/2 + 0.01 x (100,000 – 50,000)1/2)]2
P = $585

Maximum Willingness to Pay for Insurance Read More »

Complex Coin-Toss

Here is a game. If you win the game, you get a dollar; else, you lose one. What is the probability of winning the game?

The game involves a fair coin and two urns.
Urn 1: 3 red balls; 1 blue ball.
Urn 2: 1 red ball; 3 blue balls.
You toss the coin first. If heads, you draw a ball from urn 1 and if tails, urn 2. Drawing a red ball wins the game.

The marginal probability of getting a head is 1/2, and getting a red ball from Urn 1 = 3/4. Therefore, the joint probability of getting a red ball from Urn 1 is (1/2)x(3/4) = (3/8). Similarly, the joint probability of getting a red ball from Urn 2 is (1/2)x(1/4) = (1/8). The overall probability of drawing a red is

(3/8) + (1/8) = (4/8) = (1/2), same as flipping a coin.

Complex Coin-Toss Read More »

Affirming the Consequent

You must have heard similar arguments.

  1. If the lamp is broken, then the room will be dark.
  2. The House is dark.
    So:
  3. The lamp must be broken.

Or another:

  1. Binge drinking leads to liver cirrhosis.
  2. He has liver cirrhosis.
    So:
  3. He must be a binge drinker.

Affirming the consequent is a logical fallacy that starts from a true statement and jumps to the conclusion that the converse form would be true by ignoring alternative explanations. In other words, the truth of the premises can not guarantee the truth of the conclusion. Take the first example: there may be other reasons why the room is dark. It can be a power failure or someone just switched off the light.

‘the lamp is broken’ and ‘binge drinking’ are the antecedents of the arguments. The consequent in the first example is ‘the room will be dark’, and for the second example, it is ‘ liver cirrhosis.’

Smoke without fire

Then there is this proverb, “There’s no smoke without fire”. Like so many other proverbs, this one is also a fallacy.

If fire, then smoke
smoke
So:
fire

Well, there could be a smoke machine, or someone mistook fog as smoke!

Reference

Affirming the consequent: Wiki

Affirming the Consequent Read More »

Climate Change – Pew Research Survey

Motivated reasoning is the tendency to favour conclusions we want to believe despite substantial evidence to the contrary. A famous example is climate change. In the US, for example, Democrats and Republicans disagree on the scientific consensus. A recent Pew Research survey on climate change presents the magnitude of this divide.

Prioritise alternative energy

At the highest level, 67% of people support this view, which is pretty impressive. But that is 90% Democrats (and Democrat-lining) and 42% Republicans (and leaning). The only silver lining is that 67% of Republicans under age 30 support alternative energy developments.

Climate change – a major threat to the well-being

Here again, the difference between the two parties is stark. In the last 13 years, the views from the Democrats have steadily increased from 61% to 78%, acknowledging climate change as a major threat. It has remained steady and low for the Republicans – at 25% in 2010 and 23% in 2022.
Interestingly, 81% of French and 73% of Germans regard it a threat.

Americans’ views of climate change: Pew

Climate Change – Pew Research Survey Read More »

A Vegan View of Health

The Netflix documentary, ‘What the Health’, may belong to a class of faulty reasoning known as propaganda. Let’s look at some of the logical fallacies committed by the program.

The documentary intends to promote Veganism, which, I think, is fair. Food accounts for about 25% of greenhouse gas emissions, of which meat occupies half. However, the tactics used by the producer of the film range from cherry-picking to total misinformation.

Meat and cancer

The program begins with the infamous connection between processed meat and (colorectal) cancer, which comes from the 2015 findings in the International Agency for Research on Cancer (IARC). One main suspect is the production of polycyclic aromatic hydrocarbons (PAHs) during cooking by panfrying, grilling, or barbecuing. This has led to the classification of processed meat in Group 1 (Carcinogenic to humans) and red meat in Group 2A (Probably carcinogenic to humans) as per IARC.

Statistics of the low base

We already know the background of the study and what an 18% increase means. In simple language, the average prevalence of colorectal cancer (5 in 100) becomes 6 for meat eaters. As a comparison, smoking makes the lifetime risk of lung cancer 17.2 in 100 vs. 1.3 in 100 for non-smokers – a 1000% increase.

Appeal to fear

The program also chooses some of the fellow 126 candidates, such as Plutonium, Asbestos and cigarettes, to emphasise the seriousness of Group 1. On the other hand, it conveniently forgets that alcoholic beverages, areca nuts and solar radiation are a few other items on the same list. To reiterate, the items in one group do not have the same risk. A place in Group 1 only means the association (with cancer) is established for that item and nothing about the absolute risk.

Sugar-coated binary

The film then argues with the help of a few ‘experts’ that sugar, considered many as a problem molecule, plays no role in diseases such as diabetes. Such creation of the innocent-other to demonise the intended subject was totally unnecessary.

Missing the balances

The documentary slips into propaganda because it misses the balance. There is no debate here about the need to incorporate more plant-based diet and exercise in the lifestyle. It is also important to have the right amount of micronutrients and protein in the diet, which may include meat, egg and dairy products.

The documentary is propaganda as it primarily appeals to emotion. The objective is to form opinions rather than increase knowledge. It uses strategies such as cherry-picking, appealing to fear and misinformation.

References

IARC Report on Processed Meat

Known Carcinogens: Cancer.org

Carcinogenicity of Processed Meat: The Lancet Oncology

How common is colorectal cancer: cancer.org

Carbon Footprint Factsheet: umich

Climate change food calculator: BBC

IARC Classifications: WHO

IARC Group 1 Carcinogens: Wiki

Lung cancer by smoking: Pub Med

A Vegan View of Health Read More »