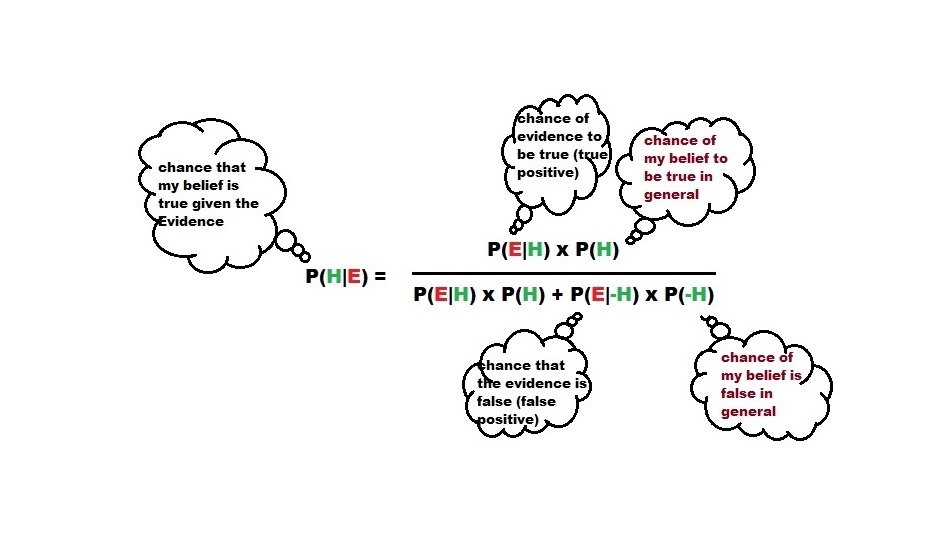
Expected Utility Model
To understand the expected utility theory, you first need to know the expected value theory. Suppose I give you this choice. If there is a 100% chance of getting 100 dollars vs a 20% chance of getting 1000 dollars, which one will you choose?
The expected value (EV), which comes from statistics, is the value multiplied by its respective probability and summed over all possible outcomes. So, for the first choice it is: 100 (dollars) x 1 (sure chance) + 0 (dollars) x 0 (no chance). For the second choice, it is 1000 x 0.2 + 0 x 0.8 = 200. Therefore the expected value of the second is double. So shall I go for the second?
That decision depends on risk and utility
The answer is no more straightforward. EV has given you the limit in terms of statistics, that the second choice yields twice the cash, but your decision follows your risk appetite. It is where the expected utility model comes in. The formula now is slightly different: instead of value, we use utility. So what is utility? The utility is the usefulness of the value.
Suppose you badly need 100 dollars, and anything higher is ok but not going to make a difference. Your utility of money might look the following plot.
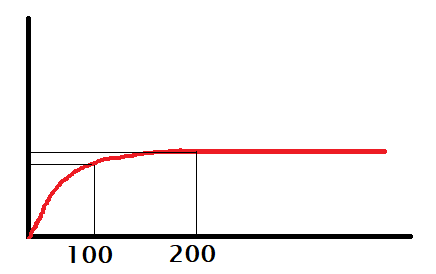
You may call her someone who desperately needs 100 bucks or a risk-averse person.
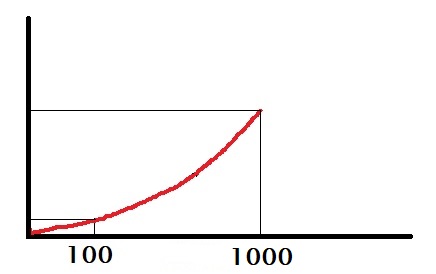
On the other hand, imagine she desperately needs 1000 dollars. In such a case, the person will gamble for 1000 bucks even when the chance of winning is only 20%. She is either a risk-lover or has no use for anything short of 1000.
Expected utility model
The expected utility (EU) of the first and the second choices are respectively:
EU1 = U(100) x 1 + U(0) x 0
EU2 = U(1000) x 0.2 + U(0) x 0
In other words, the utility function depends on the person. Suppose, for a risk-averse, it is a square root, and for a risk-lover, it could be a square. Let’s see what they mean.

Expected Utility Model Read More »