Decision Making

Collider Bias

Do you know: the students who skip classes regularly get better grades? Attractive people are more likely to be mean, and nonsmokers have more chance of getting Covid!

The instances described above are examples of what is known as collider bias or Berkson’s paradox. These typically happen in empirical studies, such as surveys. And it happens when we derive conclusions from a dataset that over-represents some groups or under-represents others.

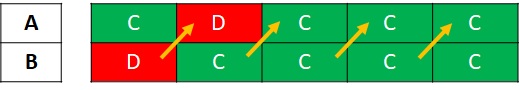
Take the case of grades. There are four possible categories: students, 1) who attend classes and get good grades, 2) who attend and get bad grades, 3) who do not attend and get good grades, and 4) who do not attend and get bad grades. The question here is: who are those pupils less likely to participate in a survey? The last group. And the result is a bias of the sample in which, among non-attenders, the percentage of good graders dominates.

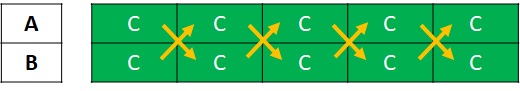
Attraction is the second example. Assume that people are classified as attractive vs not attractive, kind vs mean. Of the four possible combinations, the chances of having a date, for example, with a not attractive and mean are low, suggesting an under-representation of that combination from the list.

Collider Bias Read More »

The Truth that Exists in Mathematical Models

The concept of comparative advantage is something we saw when we analysed international trade as beneficial to both participating countries. Yet, the notion remains highly challenged by the common public. Trade, in their mind, remains a zero-sum game. If I go and sell goods in a foreign country, they lose, and I win.

Similarly, the role that the climate models play in understanding global warming. No matter how hard one tries to prove the fact using charts and equations, the public still requires to hear stories of hardships of extreme weather events to move their views. Mathematical models are inevitable as we are dealing with a complex problem with many factors that are not related linearly to the climate.

Part of the blame for this situation falls on the economists and scientists themselves. Most often, they assume the concepts they develop are simple and intuitive, and those who don’t understand are some less intelligent type.

On the other hand, people grow up hearing exaggerated stories about common sense and simple narratives. Models and equations are too difficult to understand and, therefore, some form of a trick played by the proponent.

The Truth that Exists in Mathematical Models Read More »

Trading and Pareto Efficiency – Continued

Last time we concluded that international trade was Pareto inefficient even though it made both countries richer (i.e. GDP) because it creates winners and losers within the country. But the effect can be reversed if the government shares the gains with the loser.

But this is easier said than done. Experience has shown that governments are typically slow to compensate than permitting trade.

But where is this benefit coming from? It happens because the price differential exists between two countries. One reason could be that technology makes the production of the same goods in one country cheaper than the other. The second may be the preference for different countries – country A values item 1 over item 2, whereas country B likes the opposite.

The advantage doesn’t need to be absolute; it only needs to be relative. Consider this example: there is a job that pays $100, which involves two activities. Amy can do activity 1 in 20 hrs and activity 2 in 10 hrs. Betty can perform activity 1 in 100 hrs and activity 2 in 300 hrs. Amy has an advantage in both jobs. What maximises the reward for Amy – do the job herself or partner with Betty?

Let’s analyse the following four situations:

CaseJob 1
Hrs A
Job 2
Hrs A
Job 1
Hrs B
Job 1
Hrs B
Gain A
($/hr)
Gain B
($/hr)
A job 1
A job 2
2010100/30
= 3.33
0
B job 1
B job 2
1003000100/400
= 0.25
A job 1
B job 2
2030050/20
= 2.5
50/300
= 0.16
B job 1
A job 2
1010050/10
= 5
50/100
= 0.5

Interestingly, partnering made both parties better off. This is trade 101.

Inspired by the lecture notes of David Autor, MIT department of economics.

Trading and Pareto Efficiency – Continued Read More »

Trading and Pareto Efficiency

Is international trade Pareto efficient? To understand that, we will create a scenario for the trade of a commodity from country A to country B.

Country A

Before exporting started, $4 was the price of the commodity based on the supply and demand curves.

Country B

At the same time, the price of the same item in country B was $10.

When country A exports goods to country B, the supply curve of the latter shifts by that amount to the right (to higher Q).

So the price in country B has reduced from $10 to $8.

At the same time, you may imagine that the demand curve in country A shifts to the right (towards higher Q) because by adding the new entity (country B) to the existing domestic demand, country A has increased the demand.

And the impact is? The price in country A has gone up from $4 to $6.

Country A’s consumers are hurt because of the price rise, but the producers are happy as they can enjoy a higher price in the other country. On the other hand, consumers in country B are pleased because of the lowering, but their domestic producers are unhappy as this move impacted their margin.

In country A, the consumers lost the area shaded in green (the area under the demand curve between the two prices). At the same time, the producers gained the region corresponding to the blue-shaded (the one above the supply curve between those two prices). And the net benefit is the blue-shaded triangle (blue-shaded – green-shaded). So the is a net benefit for country A.

On the other hand, in country B, the consumer gained the larger area (green), whereas the domestic producers lost the smaller (blue), and the net is a gain – the triangle that has only green shade. So a net benefit here as well.

Pareto efficiency

So the trade yielded net benefit for both countries. But was the move a Pareto improvement? It was not; because, in the process of trade, the consumers in country A are worse off, and so are the domestic producers of country B.

Trading and Pareto Efficiency Read More »

Efficiency and Equity

Consider this example:
Andy and Becky are both chocolate lovers. Andy has ten chocolates, and Becky has zero. Is the system Pareto efficient? (Hint: try taking one away from Andy and give it to Becky). The system, at this current state, is Pareto efficient. But not equitable.

Equity means the distribution of goods and services is reasonable to the parties involved. The chocolate lover Becky getting no chocolate is unlikely a reflection of an equitable society!

A market, at a competitive equilibrium, is supposed to be Pareto efficient. And this says nothing about justice. While driving efficiency is a market objective, managing equity is a political decision.

An instrument used by governments to manage this inequity is taxation. For example, in a progressive tax structure, the highest income earner will pay more proportion of their wealth compared to a lower income earner. The expectation is that the distribution of after-tax wealth is fairer than before. But you may argue that taxing is Pareto inefficient as it hurts citizens, more so the people with more wealth.

Efficiency and Equity Read More »

Pareto Efficiency

We have briefly touched upon the topic of Pareto efficiency in one of the earlier posts. Let’s understand the term a bit deeper. Start with the definition: An outcome is Pareto efficient if there is no other outcome that makes at least one person better off without leaving anyone worse off. Any move away from the efficient position will harm someone, or it is not efficient if I can make someone better off and not hurt somebody else.

Two chocolate lovers

Andy and Becky love chocolate. There were ten chocolates, and Andy got four and Becky six. Are they in a Pareto equilibirum? Test the situation by taking one chocolate away from Andy or Becky. Will it make someone unhappy? Since the answer is yes, They are in Pareto efficient state.

Prisoner’s dilemma

Time to revisit the Prisoner’s dilemma. The payoff matrix is of the following form.

Prisoner B
CooperateBetray
Prisoner ACooperate(3, 3)(1, 4)
Betray(4, 1)(2, 2)

Let’s look at each of the four outcomes. Remember, we already know that (betray, betray) is the Nash equilibrium or the rationally expected outcome.

  1. Cooperate-Cooperate (3, 3): Try to move in any direction; one of them will be worse off. For example, move to the right: player B gets richer (3 to 4), whereas A becomes poorer (3 to 1). Therefore, the state is Pareto efficient.
  2. Cooperate-Betray (1, 4): Try to go to any other quadrant; B falls short. So their current state is Pareto efficient.
  3. Betray-Cooperate (4, 1): This time, player A gets the stick. The existing condition is Pareto efficient.
  4. Betray-Betray (2,2): Move to the Cooperate-Cooperate quadrant, and both players will be better off (3 and 3), suggesting their state is not Pareto efficient.

In summary

The only outcome in the prisoner’s dilemma that is not Pareto efficient is the one that is the rational choice or the Nash equilibrium.

Pareto Efficiency Read More »

A Pair of Aces

Here is a simple probability problem that can baffle some of you. I have two decks of well-shuffled cards on the table. Take out the top card of each pack. What is the probability that at least one card is an ace of spade?

The probability of finding an ace of spades from the first deck is 1 in 52 and the same in the second deck is 1/52. Since the two decks are independent, you add the probability, i.e., 2/52 = 1/26. Right? Well, the answer is not correct! So what about (1/52)x(1/52) = 0.00037? That is something else; the probability of finding both the top cards is aces of spades. But we are interested in at least one.

You obtain the correct answer as follows:
The probability of finding no ace of spades on the top of the first deck is 51/52. The same is the chance of seeing none from the second deck. Therefore, the probability of catching no ace of spades from either deck is (51/52)x(51/52). The probability of obtaining at least one equals 1 – the probability of getting none. So, it is 1 – (51/52)x(51/52) = (52 x 52 – 51 x 51)/ (52 x 52) = 103/2704 = 0.0381.

Another way of understanding this probability is to estimate all the possible ways of pairing two cards, one from each deck, containing at least one ace of spades and then dividing it by the total number of pairs. Taking an ace from the first deck, you can have 52 combinations from the second and vice versa. So there are 52 + 52 = 104 combinations. Then you have to remove the double counting two aces, reaching 103. The total number of pairs is 52 x 52 = 2704. That leaves the required quantity to be 103/2704.

The Monty Hall Problem: Jason Rosenhouse

A Pair of Aces Read More »

Waiting for a Car

If the probability of finding at least one car on the road in 30 minutes is 95%, what is the chance of finding at least one car in 10 minutes?

Let p be the probability of not finding a car in 10 minutes so that the required probability, the probability of finding at least one car in 10 minutes, is 1- p.

The probability of finding no car in 30 minutes is a joint probability of three consecutive intervals of 10 minutes each of no cars. I.e., p x p x p = p3. But this is equivalent to 1 – the probability of finding at least one car in 30 minutes. In other words 1 – p3 = 0.95. p = cube root of (1 – 0.95) = 0.368.

So, the required probability, (1 – p) becomes 1 – 0.368 = 0.63 or 63%

Waiting for a Car Read More »

Evolution of Cooperation

The foundation of cooperation is not really trust, but the durability of the relationship

Robert Axelrod, The Evolution of Cooperation

We have seen the right strategy for the basic prisoner’s dilemma problem with one play. Defect, and get the better incentive no matter what the other player does. But when it comes to an infinite game, where the same two players play several games, there can be strategies that can make better payoffs than just defect, defect, defect!

University of Michigan Professor of Political Science and Public Policy Robert Axelrod invited experts from game theory to submit programs for a computer infinite prisoner’s dilemma game. Prof Axelrod would then pair off the strategies and find the winner. The winning design was the so-called Tit for Tat, in which the player starts with cooperation and then mirrors what the other player does.

Reciprocation

Let’s see five games between A and B in which A follows the Tit for Tat method. The payoff is similar to what we have seen in the previous post.

As expected, A starts with cooperation but, seeing B defected, changes to defect in the second game. B realises that and continues cooperating, leading to 13 points for each.

Here is the game with two Tit-for-Tat gamers, both starting with cooperation.

Very peaceful game, and each ends up with 15 points. Imagine the same game, but, for some reason, B starts with a defection.

The payoffs are fine; each defector gets five each time, but the games will follow an alternative pattern.

Evolution of Cooperation Read More »

Infinite Prisoner’s Dilemma

You know what a prisoner’s dilemma is. Here, each prisoner optimises the incentive (minimises the downside) by betraying the other. And the payoffs matrix is,

B CooperatesB Defects
A Cooperates(3,3)(0,5)
A defects(5,0)(1,1)

But what happens when the choices are repeated? Then it becomes an infinite prisoner’s dilemma.

Infinite game

Unlike the once-off, the player in the infinite game must think in terms of the impact of her decision in round one on the action of the other in round two etc. The new situation, therefore, fosters the language of cooperation.

Cooperation

The question is: how many games do the players need to realise the need for cooperation?

Concept of discounting

Let’s start the game. In the found round, as rational players, players A and B will play defect, leading to a mediocre, but still better than the worst possible, outcome.

Infinite Prisoner’s Dilemma Read More »