Here is a game. If you win the game, you get a dollar; else, you lose one. What is the probability of winning the game?
The game involves a fair coin and two urns. Urn 1: 3 red balls; 1 blue ball. Urn 2: 1 red ball; 3 blue balls. You toss the coin first. If heads, you draw a ball from urn 1 and if tails, urn 2. Drawing a red ball wins the game.
The marginal probability of getting a head is 1/2, and getting a red ball from Urn 1 = 3/4. Therefore, the joint probability of getting a red ball from Urn 1 is (1/2)x(3/4) = (3/8). Similarly, the joint probability of getting a red ball from Urn 2 is (1/2)x(1/4) = (1/8). The overall probability of drawing a red is
(3/8) + (1/8) = (4/8) = (1/2), same as flipping a coin.
If the lamp is broken, then the room will be dark.
The House is dark. So:
The lamp must be broken.
Or another:
Binge drinking leads to liver cirrhosis.
He has liver cirrhosis. So:
He must be a binge drinker.
Affirming the consequent is a logical fallacy that starts from a true statement and jumps to the conclusion that the converse form would be true by ignoring alternative explanations. In other words, the truth of the premises can not guarantee the truth of the conclusion. Take the first example: there may be other reasons why the room is dark. It can be a power failure or someone just switched off the light.
‘the lamp is broken’ and ‘binge drinking’ are the antecedents of the arguments. The consequent in the first example is ‘the room will be dark’, and for the second example, it is ‘ liver cirrhosis.’
Smoke without fire
Then there is this proverb, “There’s no smoke without fire”. Like so many other proverbs, this one is also a fallacy.
If fire, then smoke smoke So: fire
Well, there could be a smoke machine, or someone mistook fog as smoke!
We have seen how the cap and trade works. The regulator sets a maximum value for the emissions (cap). It provides allowances, in emission permits, to firms to cover each unit of CO2 (or a pollutant) produced. The company can redeem one for every emission unit or trade it to another party, who can then use it.
Additionality is a term that is closely associated with this. By trading, an emitter can buy offset rather than reduce the emission. A quality offset must mean that GHG reduction has happened by the seller as a result of a project which otherwise would not have been possible. The additionality is a positive intervention that reduces GHG. In other words, it is not additional if the reductions would have happened anyway.
An infamous example is a company that declares offset by buying credits from a project that claims to conserve a forest which was already conserved!
Well, I don’t think there is anything wrong with it! They are like the carbon tax and the cap and trade – means to charge the emitter their share of the social cost of carbon.
But what are fuel standards? These are regulations set by the government targeting to cut down CO2 emissions. For example, the US CAFE standards (corporate average fuel economy) required each manufacturer to meet two specified fleet average fuel economy levels for cars and light trucks, respectively. California pioneered the low carbon fuel standard that regulates the average carbon content per gallon of gasoline. If the former controls the amount one can burn, the latter focuses on capping the CO2 in the given amount of fuel.
Let’s understand how a fuel efficiency standard operates.
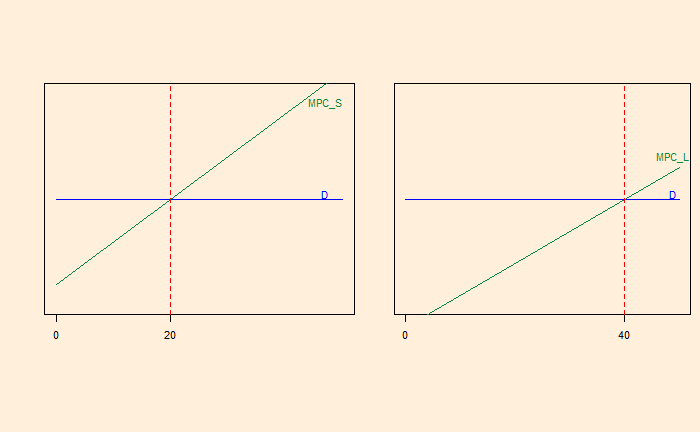
Suppose a manufacturer sells 20 small cars (S) and 40 large cars (L). Let the economies of these cards be 30 miles per gallon (mpg) for S and 10 mpg for L. The administration requires the average mpg (of the car sold) to be 20 mpg. On a simplistic level, this allows the company to sell one S for every L [(30 + 10) / 2 = 20 mpg]. Let’s look at a simplified supply-demand curve.
MPC = Marginal Private Cost or the change in the producer’s total cost brought about by the production of an additional unit. The flat demand curve means it is perfectly competitive.
Naturally, this must change as per regulation because the average mpg is (20 x 30 + 40 x 10) / 60 = 16.7; less than 20. One solution is to reduce L production to 20 and bring the mpg to the compliance level.
The shaded triangle on the right is the amount of profit that is forfeited in this exercise. What happens if I sell five more Ls? It would mean the company must sell five more Ss at a loss.
This process can go on until the red-shaded area on the left matches with the green-shaded area on the right. That means the S car sales increase.
So, a performance standard subsidises the product, which makes the standard easier. In other words, the firm taxes the poor-performing car by subsidising the better performer. The plot will tell you that L is sold at a price higher than its marginal cost, whereas S is sold below its marginal cost.
So, what is wrong with fuel standards? There is a possibility that the firm ends up selling more cars than it would do otherwise. There is also a possibility for the Jevons paradox, where people end up driving the fuel-efficient car more (rebound).
Motivated reasoning is the tendency to favour conclusions we want to believe despite substantial evidence to the contrary. A famous example is climate change. In the US, for example, Democrats and Republicans disagree on the scientific consensus. A recent Pew Research survey on climate change presents the magnitude of this divide.
Prioritise alternative energy
At the highest level, 67% of people support this view, which is pretty impressive. But that is 90% Democrats (and Democrat-lining) and 42% Republicans (and leaning). The only silver lining is that 67% of Republicans under age 30 support alternative energy developments.
Climate change – a major threat to the well-being
Here again, the difference between the two parties is stark. In the last 13 years, the views from the Democrats have steadily increased from 61% to 78%, acknowledging climate change as a major threat. It has remained steady and low for the Republicans – at 25% in 2010 and 23% in 2022. Interestingly, 81% of French and 73% of Germans regard it a threat.
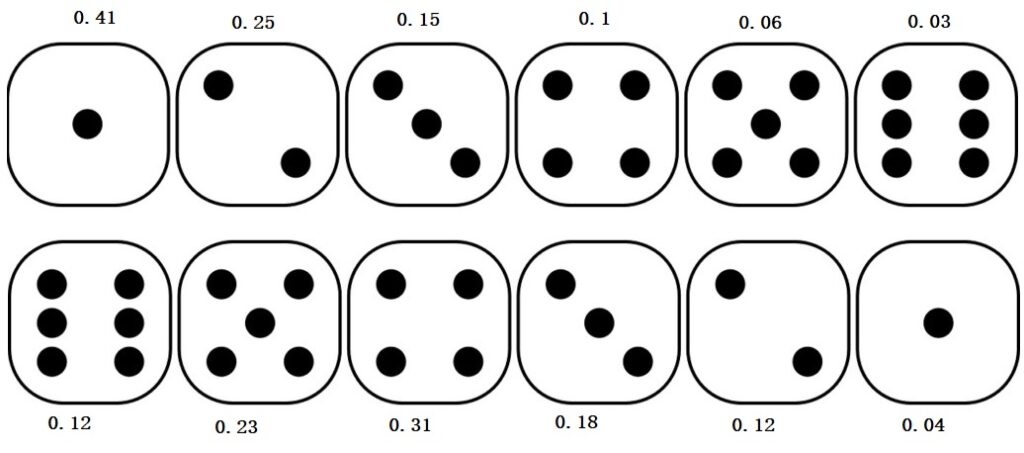
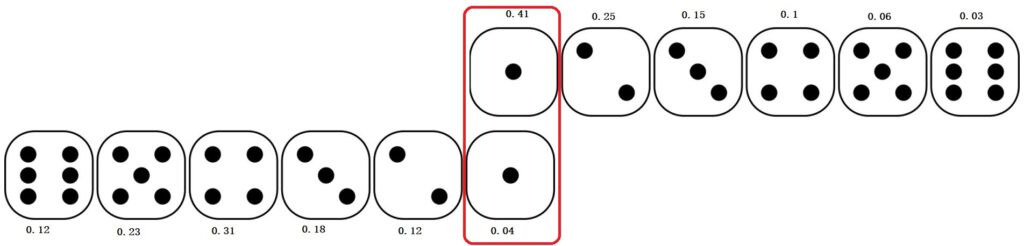
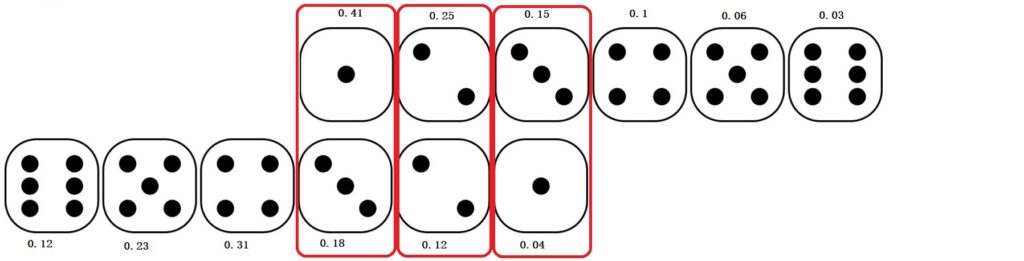
We have seen how the probability of double dice can be estimated by flipping and sliding the outcomes of the second die. Here is another example to illustrate the concept: this time, with two dice with different probabilities.
0.41 x 0.04 = 0.0164
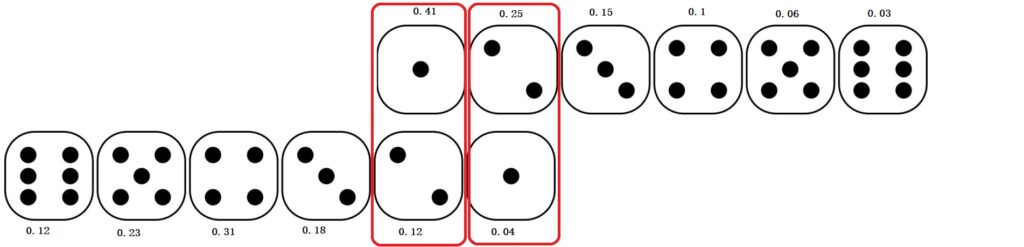
0.25 x 0.04 + 0.41 x 0.12 = 0.0592
0.15 x 0.04 + 0.25 x 0.12 + 0.41 x 0.18 = 0.1098
Why X+Y in probability is a beautiful mess: 3Blue1Brown
Can displaying wrong images justify a right cause? Today, we discuss pollution.
It is no longer a matter of debate that pollutants cause massive health hazards. As per the World Health Organisation (WHO), air pollution caused 4.2 million premature deaths worldwide in 2019. Most of it is manifested via cardiovascular and respiratory diseases and cancer.
The following are the five main entities that cause air pollution. Those are Particulate matter (PM) Carbon monoxide (CO) Ozone (O3) Nitrogen dioxide (NO2) Sulfur dioxide (SO2)
You may have noticed the conspicuous absence of carbon dioxide in this list. This is because CO2 is not a pollutant but a greenhouse gas that causes global warming. So, it is a bad actor, though not exactly the way one would imagine.
Now, the fallacy: below is a photo I got when I typed ‘pollution’ in the image search column, followed by another picture that came up for ‘carbon dioxide’.
The sorry thing is that neither of these shows pollutants nor CO2. These are images of cooling towers emitting water vapour; journalists have been using such images from power plants and other industries for ages to represent pollution and global warming. The reason? They make excellent visuals of dense plumes, captivating the readers. According to a 2007 Royal Society of Chemistry survey report, more than two-thirds of people in the UK believe these images are of carbon dioxide emissions and accelerating climate change.
We have seen how the probability of getting a given sum can be estimated pictorially when two dice are thrown. It is done by displaying all possible combinations of 6 outcomes each (total of 6 x 6 = 36) and then counting the number of pairs for a given sum.
You will see these pairs along the diagonals.
For example, the probability of getting a sum of four is 3/36 by counting along the line that passes through all 4s. And if you do it for each diagonal, you get the following distribution.
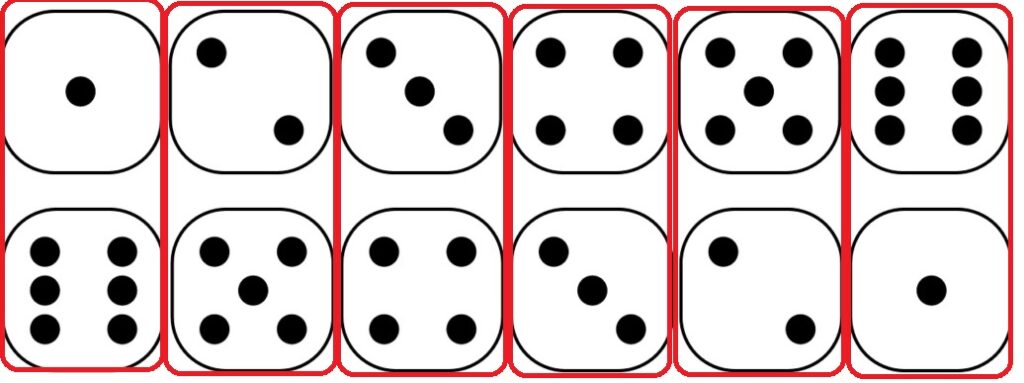
There is an even smarter way to reach the above. It is done by listing the outcomes of the first die on the top row, flipping around the one from the second die and placing it below.
All the pairs that add up to seven appear as shown below. There are six of them.
Slide the second row to the right by one, and you get the 8s (5 out of 35).
This flipping (and then sliding) is a convenient way to understand convolution!
Observe the p-values (Pr(>|z|)) for the regression coefficients, and we find that only ‘Age’ and ‘Ser_Cr’ have significant contributions to the response variable, ”Death. Therefore, we can already do a good job by fitting only those two variables.