Decision Making

The Zero-Sum Fallacy

In life, your win is not my loss. This is contrary to what used to happen when we were hunter-gatherers, fighting for a limited quantity of meat or in the sporting world, where there is only one crown at the end of a competition. And changing this hard-wired ‘wisdom of zero-sum’ requires conscious training.

The Double ‘Thank You’ Moment

In his essay, The Double ‘Thank You’ Moment, John Stossel uses the example of buying a coffee. After paying a dollar, the clerk says, “Thank you,” and you also respond with a “thank you.” Why?
Because you want the coffee more than the buck, and the store wants the buck more than the coffee. Both of you win.”
Except under coercion, transactions lead to positive-sum games; otherwise, the loser wouldn’t have traded.

A great example of our world of millions of double thank-you moments is apparent from how the global GDP has changed over the years.
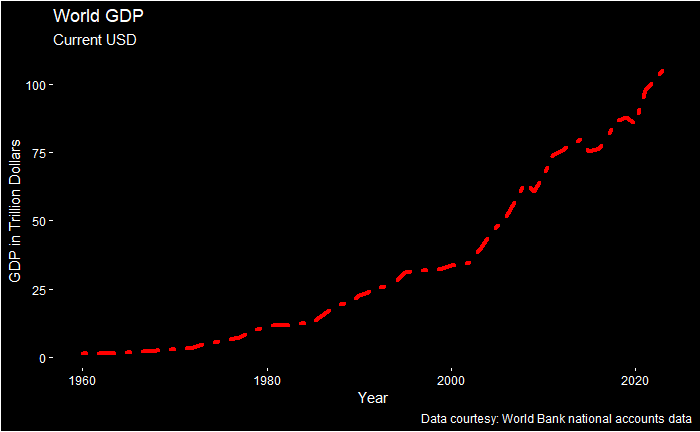
Notice that the shape of the curve is not flat but is exploding lately due to the exponential growth in transactions between people, countries and entities.

Inequality rises; poverty declines

One great tragedy that extends from the zero-sum fallacy is the confusion of wealth inequality with poverty. In a zero-sum world, one imagines that the rich getting richer must be at the expense of the poor! In reality, what matters is whether people are coming out of poverty or not.

Reference

GDP: World Bank Group
The Double ‘Thank You’ Moment: ABC news

The Zero-Sum Fallacy Read More »
Bayesian Data Analysis – A/B Testing

We have seen how Bayesian analysis is done to get the most probable parameter that would have resulted in the observed data for a single set.

  1. Data
  2. A generative model: a mathematical formulation that can give simulated data from the input of parameters.
  3. Priors: information for the model before seeing the data

This time, we analyse two sets of data and compare them. The method is similar to what we have done for the single set.

Problem statement

There were two campaigns: one received positive reviews in 6 out of 10 and the other in 9 out of 15. We must compare them and report the better method, including the uncertainty range.

Unlike before, we will run two models side by side this time. Draw a random parameter 1 value from the prior1.

prior1 <- runif(1, 0, 1)

Run the model using prior1 to estimate simulated value 1.

sim1 <- rbinom(1, size = 10, prob = prior1)

In the same way, run the second model using another uniform prior.

prior2 <- runif(1, 0, 1)
sim2 <- rbinom(1, size = 15, prob = prior2)

Accept the parameter values (prior1 and prior2) only if the posteriors (sim1 and sim2) match the data, 6 and 9, respectively.

Now, you can find the difference between the two posteriors, resulting in a new distribution.

Reference

Introduction to Bayesian data analysis – part 2: rasmusab

Bayesian Data Analysis – A/B Testing Read More »

Bootstrapping

Suppose a drug was tested on eight people. Five people became better, and three did not. How do we know if the drug works? Naturally, eight is far from the population of a region, which could be in the thousands.

The bootstrapping technique fundamentally pretends that the sample histogram is the population histogram. It then performs repeated sampling (with replacement) from the collected dataset. It creates histograms of outcome statistics of what might have been obtained if the experiment had been done several times.

Here are the eight data collected. The positive values correspond to people who improved with the drug, and the negative values are the opposite.

data <- c(-3.5, -3.0, -1.8, 1.4, 1.6, 1.7, 2.9, 3.5)

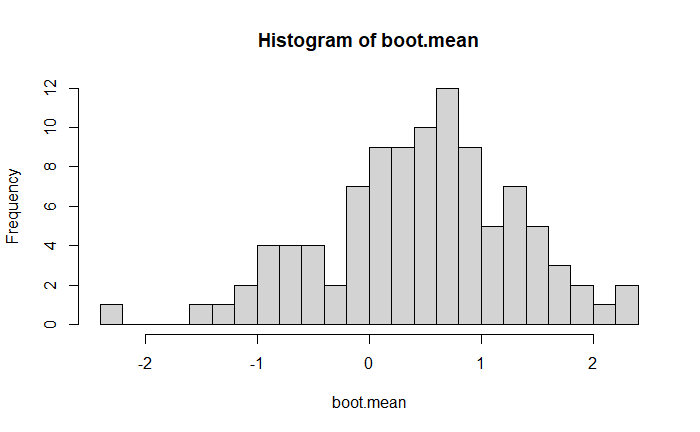
Let’s randomly sample from this a hundred times, estimate the mean each time and plot the histogram of it.

resamples <- lapply(1:100, function(i) sample(data, replace = T))
boot.mean <- sapply(resamples, mean)
hist(boot.mean, breaks = 20)

Note that when randomly sampling from the dataset, some data can come multiple times; therefore, we see the histogram (distribution) of the mean.

Bootstrapping Read More »

Bayesian Data Analysis – Developing the Scheme

Let’s demonstrate the analysis using an example. An advertising campaign for a product surveyed 16 people, and 6 of them responded positively. What are the expected product sales when it is launched on a large scale?

The simplest way is to divide 6 by 16 = 38% and conclude that this is the potential hit rate. However, this has large uncertainty (due to the small sample size), and we must account for that. Remember the steps of Bayesian inference.

  1. Data
  2. A generative model: a mathematical formulation that can give simulated data from the input of parameters.
  3. Priors: information for the model before seeing the data

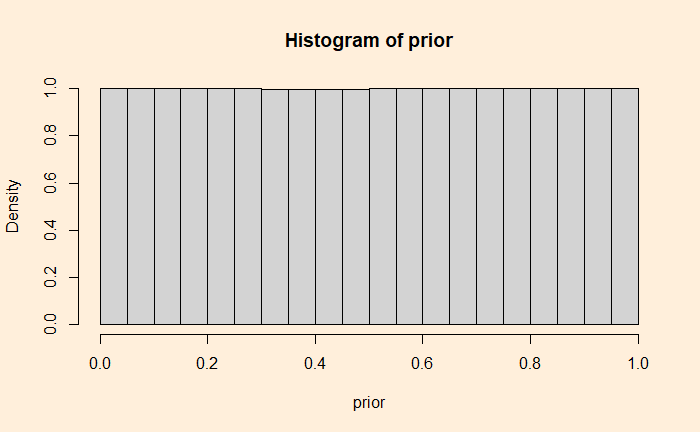
We have data, and we need a generative model. The aim is to determine what parameter would have generated this data, i.e., the likely rate of positive ‘vibe’ in public that would have resulted in 6 out of 16. Assuming individual preferences are independent, we can utilise the binomial probability distribution as the generative model. Now, we need the parameter value. Since we don’t know that, we use all possible values or a uniform distribution.

Now, we start fitting the model. Draw a random parameter value from the prior.

prior <- runif(1, 0, 1)
0.4751427

Run the model using 0.4751427

rbinom(1, size = 16, prob = 0.4751427)
8

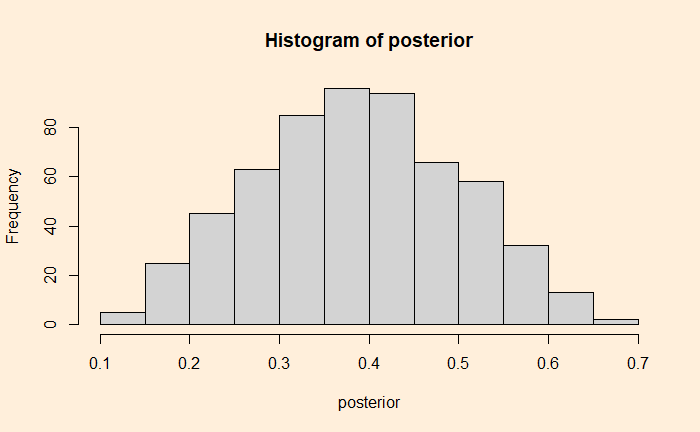
Well, this doesn’t fit because the output is not 6, but 8. Repeat this sampling and model-runs several times, collect the parameter values that result in 6 and make a histogram.

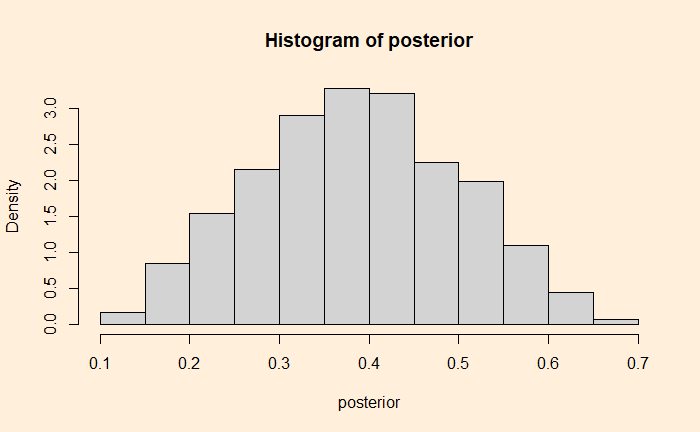
The first takeaway is that parameter values below 0.1 and above 0.7 have rarely resulted in the observed data. The median posterior turns out to be 0.386.

Finding the posterior distribution is the goal of Bayesian analysis. The value 0.386 (38.6%) is the most probable parameter value that would have resulted in the observed data—the famous “maximum likelihood estimate.”

Reference

Introduction to Bayesian data analysis – part 1: What is Bayes?: rasmusab

Bayesian Data Analysis – Developing the Scheme Read More »

Bayesian Data Analysis

Earlier, we saw how John K. Kruschke explained Bayesian inference in his book, “Doing Bayesian Data Analysis”. Today, I will present another elegant description from the YouTube channel “rasmusab”. He explains Basian Data Analysis as:

“A method to figure out unknowns, known as parameters, using”

  1. Data
  2. A generative model: a mathematical formulation that can give simulated data from the input of parameters.
  3. Priors: information for the model before seeing the data

So, the objective is to estimate a reasonable set of parameter values that could have generated the data, as observed. And it is done in this fashion:
Plug in a parameter value
Run it through the generative model
Get out the simulated data
Accept only those parameter values that gave the simulated data = observed data.

Reference

Doing Bayesian Data Analysis by John K. Kruschke
Introduction to Bayesian data analysis – part 1: What is Bayes?: rasmusab

Bayesian Data Analysis Read More »

Interpretations of Probability

This time, we examine how different schools of mathematicians and philosophers have interpreted the concept of probability. We consider five different versions.

Classical approach

The earliest version. Thanks to people such as Laplace, Fermat, Pascal, etc, who wanted to explain the principles of games of chance (e.g., gambling). In their definition, for a random trial, the probability of outcomes equals
# of favourable cases / total # of equally possible cases.
This way, a coin has one out of two (1/2) probability to land on a head, and a dice has a one out of six (1/6) chance to land on number 4, etc.

But this leads to a problem, e.g., the probability of rain tomorrow. If the favourable outcome is rain, what are those “equally possible outcomes” – {rain, no rain}? In that case, the probability is
{rain}/{rain, no rain}
is always 1/2, which can not be true!

Logical approach

We know the format of a logical statement – premise leading to conclusions. It defines an argument as one of the two categories – deductively valid or invalid. If the premises entail the conclusion ie.e., true premises guarantee a true conclusion, it’s a valid argument. On the other hand, a conclusion which is not true, even if the premises are all true, is an example of a deductively invalid argument.

What about something in between?
Premise 1: There are 10 balls in a jar: 9 blue and 1 white
Premise 2: One ball is randomly selected
Conclusion: The selected ball is blue

The argument is deductively invalid, but we know the chance of this conclusion being right is high. In other words, the premises partially entail the conclusion. The degree of partial entitlement is probability.

Frequency approach

We all know about the frequency interpretation of probability. Take a coin, toss it and record the sequence of outcomes. Estimate the number of heads over the number of tosses. The long-term ratio or the relative frequency is the probability of heads on a coin toss.

Probability = relative frequency as the # of trials reaches infinity.

But then, what is the probability of a single-case event?

Bayesian approach

What is the probability that I pass today’s exam? Naturally, I don’t have a chance to do a hundred exams and inspect the outcomes. I must express some confidence and give a subjective (gut) feeling. In other words, the probability I assign is a degree of belief.

Note that in the Bayesian approach, we are prepared to ‘update‘ the initial degree of belief based on evidence.

Propensity approach

Propensity is a term coined by the philosopher Karl Popper. Consider the flipping of a fair coin. This philosophy school argues that it’s the physical property or the propensity of the coin that produces a head 50% of the time. And the numerical probability just represents this propensity.

Reference

Interpretations of the Probability Concept: Kevin deLaplante

Interpretations of Probability Read More »

Prisoner’s Envelope

Professor Hugo F. Sonnenschein of the University of Chicago explains the famous prisoner’s dilemma differently.

There are two players, A and B, and a moderator. The moderator hands A and B a dollar each and an envelope. Players can keep the dollar in their pocket or leave it inside the envelope. Players then return the envelope to the moderator; the moderator can’t see what each has done. The moderator then looks at the envelopes and doubles the amount she sees inside them. In other words, if she sees a dollar inside the envelope, she makes it two; she doesn’t add anything if she sees nothing.

The moderator then switches the envelopes (envelope A to B and B to A) and gives them back to the players. What is the best strategy for the players to do in the first place—keep the dollar inside the envelope or hold it with them?

Player A can do two things with four possible outcomes; one guarantees a profit.

Keep the dollar in the pocket and return an empty envelope. This guarantees $1 if the other player does the same, or A gets two more dollars if player B is magnanimous (returning her envelope with a dollar in it).

The second option for player A is to return the envelope with one dollar in it. Again, there are two possible outcomes: A gets nothing if player B follows A’s first strategy (keeping a dollar in her pocket) or two if the other returns with a dollar in the envelope.

If you want to be formal with the payoff matrix, here it is.

While it is perfectly understandable that corporation (by each putting their dollars inside the envelope) brings prosperity to both (2 dollars each), the game theory doesn’t work that way. It will give you a strategy that guarantees you a profit irrespective of what the other person would do. In other words, the rational approach is to be selfish.

Game Theory and Negotiation: Becker Friedman Institute University of Chicago

Prisoner’s Envelope Read More »

Gambler’s Ruin

A gambler starts with a fixed amount of money ($i) and bets $1 in a fair game (i.e., the probability of winning or losing is 0.5) each time until she has 0 or n dollars. What is the probability she ends up with $0, and what chance does she get $n?

This is a perfect example of a Markov process. This is because the only thing relevant to the gambler at any point in time is the money she has at that time. Imagine her end goal is to reach 5. Let’s assume she has p chance to win a dollar and q = 1-p chance to lose the bet amount. The Markov chain representation is as follows.

Here is the translation matrix.

Take two cases: a fair bet (p = 0.5, q = 0.5) and a favourable bet (p = 0.6, q = 0.4). She starts with $3, represented as X = [0, 0, 0, 1, 0, 0]. Note that the first element represents 0, then 1, etc, and the sixth element denotes 5 (the goal). After 50 steps, the end state probability is,
P50 * X

P50 * [0, 0, 0, 1, 0, 0] = [0.4, 0, 0, 0, 0, 0.6]. The answer has to be the fourth column of P50. There is a 40% chance she ends up 0 and a 60% chance it’s 5$.

By the way, for p = 0.5, the analytical solution for the probability of reaching n, starting from i, is,
ai = i/n; a3 = 3/5 = 60%.

For p does not equal 0.5, it is,

ai = (1 – ri)/(1 – rn)
r = (1-p)/p

Now, imagine the probability of winning is 0.6.

p = 0.6; r = 0.4/0.6 = 0.67
a3 = (1 – r3)/(1 – r5) = 0.81
See the fourth column of the matrix above.

L26.9 Gambler’s Ruin: MIT OpenCourseWare

Gambler’s Ruin Read More »

Markovian Umbrella Run

Becky has four umbrellas. During her workday, she travels between home and the office. She takes an umbrella only when it rains; otherwise, it remains where it was last—in the office or at home. Suppose on a given day that all her umbrellas are in the office, whereas she’s at home preparing for the office, and if it rains, she will get wet. The question is:
If the location has a 60% probability of rain, what is the chance that Becky gets wet?

The problem can be solved as a Markovian chain. For that, we must divide the conditions into five states. They are
0: no umbrella state
1: one umbrella
2: two umbrellas
3: three umbrellas
4: four umbrellas

We must know what movements are possible from one state to another to develop translation probabilities.

From 0: Becky must go from 0 to 4, from one place without an umbrella to the other with all umbrellas. As this must happen irrespective of whether it rains or not, the probability of this movement is 1.

From 1: If it rains, p = 0.6, Becky carries the umbrella with her. In other words, she goes from state 1 to state 4 (3 already + 1 incoming).
If it doesn’t rain, p = 0.4, she will go from state 1 to state 3.

From 2: If it rains, state 2 to state 3. If it doesn’t rain, she will go from 2 to 2.

From 3: If it rains, 3 to 2; if it doesn’t, 3 to 1.

From 4: If it rains, 4 to 1; if it doesn’t, 4 to 0.

Here is the diagram representing the chain.

The translation matrix is

The required task is to find the stable end distribution of cities, which can be done using the relationship.

Xn = Pn X0

We use the Matrix calculator for P100

Multiply this with any starting distribution, we get the end state probabilities as,

The probability that she’s at state 0, P(0) = 0.09. Since the probability of rain when Becky is at 0 state is 0.6, the chance she gets drenched is 0.09 x 0.6 = 0.054 or about 5%.

Markovian Umbrella Run Read More »

Viterbi Algorithm – NLP

Let’s try out the Viterbi Algorithm using the example given in the ritvikmath channel using R. It is about parts of speech tagging of a sentence,
“The Fans Watch The Race”.

The transition and emission probabilities are given in matrix forms.

hmm <- initHMM(c("DET","NOUN", "VERB"), c("THE","FANS", "WATCH", "RACE"), transProbs=matrix(c(0.0, 0.0, 0.5, 0.9, 0.5, 0.5, 0.1, 0.5, 0.0), nrow = 3),
	emissionProbs=matrix(c(0.2, 0.0, 0.0, 0.0, 0.1, 0.2, 0.0, 0.3, 0.15, 0.0, 0.1, 0.3), nrow = 3))
print(hmm)
$States
[1] "DET"  "NOUN" "VERB"

$Symbols
[1] "THE"   "FANS"  "WATCH" "RACE" 

$startProbs
      DET      NOUN      VERB 
0.3333333 0.3333333 0.3333333 

$transProbs
      to
from   DET NOUN VERB
  DET  0.0  0.9  0.1
  NOUN 0.0  0.5  0.5
  VERB 0.5  0.5  0.0

$emissionProbs
      symbols
states THE FANS WATCH RACE
  DET  0.2  0.0  0.00  0.0
  NOUN 0.0  0.1  0.30  0.1
  VERB 0.0  0.2  0.15  0.3

Now, write down the observations (The Fans Watch The Race) and run the following commands.

observations <- c("THE","FANS", "WATCH", "THE", "RACE")

vPath <- viterbi(hmm,observations)

vPath 
 "DET"  "NOUN" "VERB" "DET"  "NOUN"

References

The Viterbi Algorithm: ritvikmath

Viterbi Algorithm – NLP Read More »