Data & Statistics

Law of Large Numbers

The last time we did random sampling and counting, also known as the Monte Carlo experiments. Today we build two programs to demonstrate what is called the law of large numbers through two examples, coin tossing and die rolling. In case you forgot, the law of large numbers is a phenomenon where the actual value starts converging to the expected value as the number of events increases.

Coin Toss

Imagine you are in a coin game: you get 1 dollar for a head and nothing for a tail. What is the average amount you are gaining from the play? We create an R program that calculates the average of several sampling outcomes and plots it as a function of the number of games played.

fin_number <- 1000
xx <- replicate(fin_number,0) # initiating vector
yy <- replicate(fin_number,0) # initiating vector

for (rep_trial in 1:fin_number) {
 
win_fr <- replicate(rep_trial, {
  try <- sample(c(1,0), size = 1, replace = TRUE, prob = c(0.5,0.5))
  })
 xx[rep_trial] <- rep_trial
 yy[rep_trial] <- mean(win_fr) 
}


par(bg = "#decdaa")
plot(xx,yy, type = "l", main = "Average returns with games played", xlab = "Games Played", ylab = "Average Return", xlim = c(0,1000), ylim = c(0,1))
abline(h = 0.5, col="red", lwd=2, lty=2)
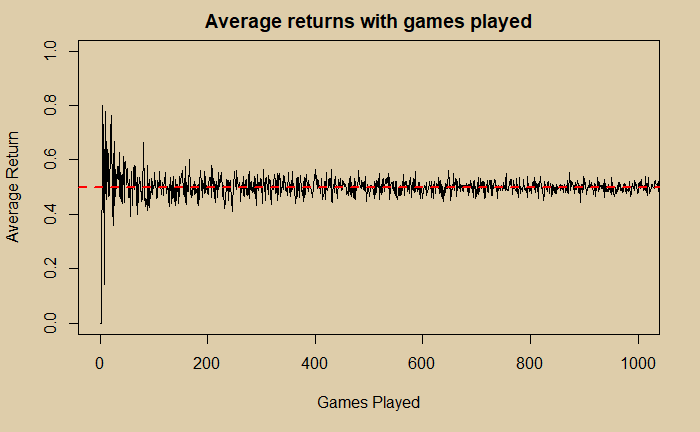
The code uses four functions in R – for loop, replicate, sample and plot. The red dotted line represents the expected probability of 0.5 for a head in coin-tossing.

Dice Roll

In this game, you get one point when you roll a 1, nothing otherwise.

fin_number <- 1000
xx <- replicate(fin_number,0)
yy <- replicate(fin_number,0)

for (rep_trial in 1:fin_number) {
 
win_fr <- replicate(rep_trial, {
  die_cast <- sample(c(1,2,3,4,5,6), size = 1, replace = TRUE, prob = c(1/6, 1/6, 1/6, 1/6, 1/6, 1/6))
if (die_cast == 1) {
  counter = 1
} else {
  counter = 0
}
  })

xx[rep_trial] <- rep_trial
yy[rep_trial] <- mean(win_fr) 

}

par(bg = "#decdaa")
plot(xx,yy, type = "l", main = "Average returns with games played", xlab = "Games Played", ylab = "Average Return", xlim = c(0,1000), ylim = c(0,1))
abline(h = 1/6, col="red", lwd=2, lty=2)
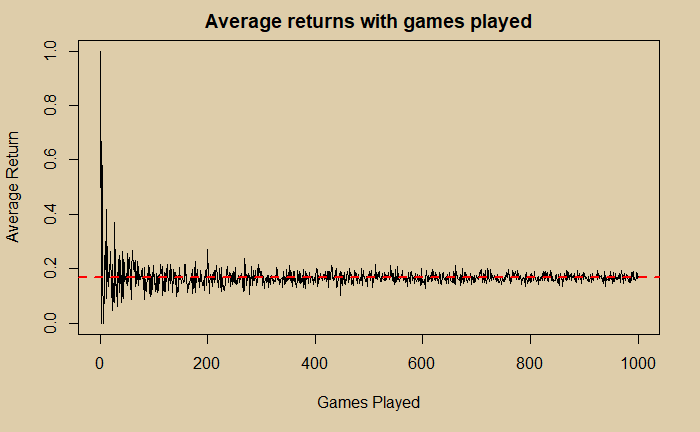
You know the probability of obtaining a 1 from the rolling of a fair die is (1/6), which is represented in the figure by the red dotted line.

The Roulette

I can not stop this post without referring to Roulette. Here is what we obtain, by setting probabilities to (18/38) and (20/38) for winning 1 and -1, respectively.

fin_number <- 1000
xx <- replicate(fin_number,0)
yy <- replicate(fin_number,0)

for (rep_trial in 1:fin_number) {
 
win_fr <- replicate(rep_trial, {
  try <- sample(c(1,-1), size = 1, replace = TRUE, prob = c(18/38,20/38))
})
xx[rep_trial] <- rep_trial
yy[rep_trial] <- mean(win_fr) 
}

par(bg = "#decdaa")
plot(xx,yy, type = "l", main = "Average returns with games played", xlab = "Games Played", ylab = "Average Return", xlim = c(0,1000), ylim = c(-1,1))
abline(h = 0.0, col="red", lwd=2, lty=2)
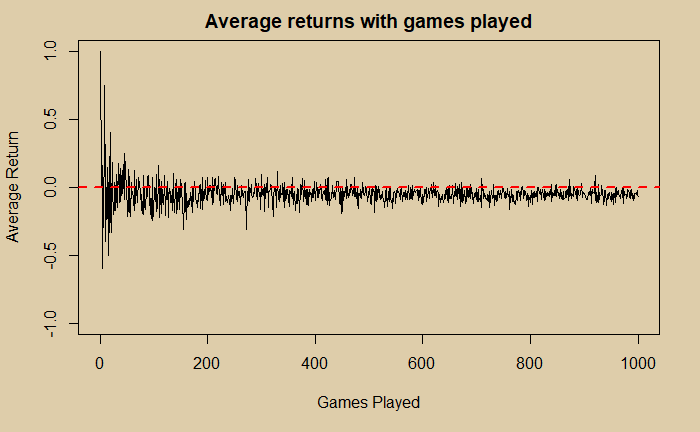
You can see that you have more possibilities to get some money (> 0) as long as you leave early from gambling. As you keep playing more and more, your chances of making anything in the end diminish.

Law of Large Numbers Read More »
A Banana Problem and an R Solution

The last banana is a probability riddle by Leonardo Barichello that I found in a TedEd video. It is a thought experiment as follows:

Two players are playing a game by rolling two dice. If the higher number of the two is 1, 2, 3 or 4, player A wins, whereas if it is 5 or 6, player B wins. Who has a better chance of winning the game?

Let’s play a million times

The primary aim of this post is to develop an R code that generates a million such games and calculate how many times A and B win. We will then compare the results with the theoretical solution.

A die has six sides, and an unbiased one gives equal chances for each of its faces, numbered one to six. In other words, the probability of getting any of the numbers is one in six or (1/6). So, first, we need to create a die, roll it two times and get two random outcomes.

Random generator

The sample function in R can make random numbers from the given sample space at the specified probabilities.

sample(c(1,2,3,4,5,6), size = 2, replace = TRUE, prob = c(1/6, 1/6, 1/6, 1/6, 1/6, 1/6))

The code has four arguments: the first one, c(1, 2, 3, 4, 5, 6), is an array of all possible outcomes. The second is size, the number of times you want to choose. Here we gave two, corresponding to the two dice rolls. ‘replace is TRUE’ because you want to replace what came out in the first roll before the second roll. Finally, you provide probabilities of occurrence for each element in the sample space. There are six in total, and because it is a fair die, we give them equal chances (1/6). When I ran the code 5 times, the following is what I got.

[1] 1 6
[2] 1 4
[3] 2 3
[4] 4 6
[5] 2 6

If you recall the rules, player A wins two times (games 2 and 3), and player B wins three (games 1, 4 and 5). But, to get a reasonable certainty for the probability by counting the outcomes (the frequentist way), you need to play the game at least 1000 times! And we are going to automate that next.

Repeating the exercise

The replicate function can repeat an evaluation as many times as you specify. A simple example is.

replicate(3,"Thougthful")

can give an output

[1] "Thougthful" "Thougthful" "Thougthful"

Instead, if you want to give a chunk of calculations and repeat, you can use brackets like this:

jj <- replicate(3, {
          1
  })
jj

The output of the above expression is 1 1 1.

Back to bananas


repeat_game <- 1000000

win_perc_A <- replicate(repeat_game, {

   die_cast <- sample(c(1,2,3,4,5,6), size = 2, replace = TRUE, prob = c(1/6, 1/6, 1/6, 1/6, 1/6, 1/6))
     if (max(die_cast) <= 4) {
     counter = 1
   } else {
     counter = 0
   }

}
)

mean(win_perc_A)

The code will repeat the sampling a pair of numbers, estimate the maximum (max function) of the duo and count if the maximum is less than or equal to 4 (by assigning 1 for the target and 0 otherwise) a million times. Finally, you either count the successes (of A) or calculate the mean; I went for the latter.

To end

The analytical solution is rather easy. The criterion for player A to win this game is if both rolls remain at four or below. The probability of the first roll remaining at four or below is (4/6). The same is for the second roll. Since the rolls are independent, you get the joint probability of two die rolls by multiplying the numbers. (4/6) x (4/6) = 16/36 = 0.4444.

Now, what was the answer to the simulation? By taking an average of the counts of a million games, the answer was 0.444193. Not bad, eh?

So, the answer to the riddle? You better be player B in this game with about a 56% chance to win.

The last banana: A thought experiment in probability – Leonardo Barichello

A Banana Problem and an R Solution Read More »

Permutations and card Shuffle

Permutations enable us to calculate the number of ways of arranging something and when the order matters. An example is the number of unique manners of placing three people, A, B, and C, on a podium, where first, second and third matter!

A B CA C BB A C
B C AC A BC B A

The formula for the permutations of n available options taken r at a time is nPr.

_nP_r = \frac{n!}{(n-r)!} = \frac{3!}{0!} = 3 * 2 * 1= 6 \text{; for 0! = 1} \\

So, what is the number of unique ways of shuffling a deck of cards?

_{52}P_{52} = \frac{52!}{(52-52)!} = \frac{52!}{0!} = 52! = 8.1 \text{x}10^{67}

Eight followed by 67 zeroes is a mind-blowingly large number and is far more than the number of atoms on this planet. Next time, when you shuffle a deck of cards, remember this arrangement may never have happened in this history and may never be happening again.

Factorial Calculator

Number of atoms in the world: Fermilab

Permutations and card Shuffle Read More »

The 100 Prisoners Problem

In the previous post, we have seen a variation of the 100 prisoners problem applied to the Monty Hall problem. But what is the 100 prisoners problem?

One hundred prisoners numbered 1 to 100 are given a choice to free themselves if they all find their numbers, written on a piece of paper, randomly kept inside 100 boxes numbered 1 to 100. In other words, the bit carrying number 8 could be inside box 64, #21 inside box 99 etc. The room that keeps the boxes allows only one prisoner at a time, and he can open a maximum of 50 boxes. Even if one fails in his attempt, the whole group loses, and none will walk free. Prisoners can discuss strategies only before the game.

The Strategy

Suppose each player tries opening boxes at random. The probability of a person finding his number from 100 boxes by opening 50 is (50/100) or (1/2). For 100 people to find their numbers, the chances are (1/2) multiplied 100 times or (1/2100), a number close to zero.

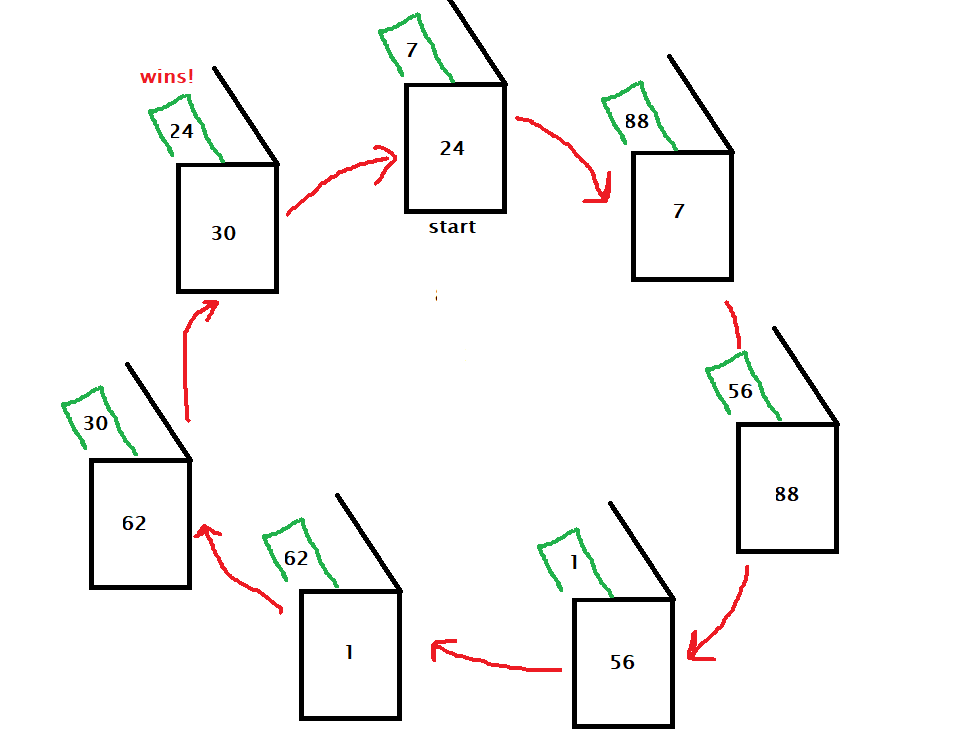
Instead, they decide on a strategy; the person first opens the box that carries his number. If he finds his number, fine or else he goes to the box that corresponds to the number inside the first box. It continues until one of the two things happens. He finds his number, or he reaches the maximum of 50 attempts. This strategy can raise the probability of success to a mind-boggling 31%!

To understand this, take the case wherein the prisoner finds his number inside a box. If he continues the strategy, the number he just discovered, which is his number, will lead to the container that carries his number, which is nothing but the first one he opened. Or he always completes a circle of 50 (or lower) boxes if he is successful. Every unsuccessful attempt means the (unfinished) loops are longer than 50.

The travel of prisoner number 24

Each prisoner makes one loop

So the problem becomes the collection of such loops. The probability that such a cluster has no loop larger than 50 is 31%.

The 100 Prisoners Problem Read More »

Car – Key Challenge

Here is a variation of the Monty Hall problem based on the 100 prisoner challenge.
Three objects – a car, a key and a goat – are randomly placed behind three doors. You play the game with a partner. And each of you can open a maximum of two doors, one person at a time. In order to win the car, the first player must find the car, and the second the key.

If the players play at random, the probability of the first player to find the car in two attempts (out of the possible three doors) is 2/3. Similarly, for the second, finding the key is 2/3. The probability of winning is (2/3) x (2/3) = 4/9 = 44.4%.

Strategy

If they do the following strategy, they can maximise the probability to (2/3), which is equal to the chance of any of them reaching their individual goal. Here is how they do it.

Person 1 goes and opens door 1. If she finds the car, she completes her task and over to person 2. If instead, she finds a key, she will try door 2. Whereas, if she finds a goat on the first attempt, she will go for door 3.

The second person might not start 1 out of 3 times, i.e. whenever the first person was unsuccessful. If that is not, she will first open door 2. If it was a key, the team wins. If she finds a goat behind door 2, she will open door 3; if it is a car, she will open door 1. The possibilities are in the table below.

Sequencecar-key-goatcar-goat-keykey-car-goat
Player 1door 1: cardoor 1: cardoor 1: key
door 2: car
Player 2door 2: key
(wins)
door 2: goat
door 3: key
(wins)
door 2: car
door 1: key
(wins)
Sequencekey-goat-cargoat-key-cargoat-car-key
Player 1door 1: key
door 2: goat
door 1: goat
door 3: car
door 1: goat
door 3: key
Player 2no gamedoor 2: key
(wins)
no game

You can see that whenever the first person does her job (wins the car), the second one gets the keys.

Car – Key Challenge Read More »

First Instinct Fallacy

Our fundamental instinct to resist changes reflects well in the first-instinct fallacy of answering multiple-choice questions. However, studies have time and again suggested in favour of rechecking and updating the initial ‘gut feel’ as a test-taking strategy. One such example is the test conducted by Kruger et al. in 2005.

Following the eraser

The study followed eraser marks of 1561 exam papers for a psychology course at UIUC. The researchers categorised the changes in answers into three, viz., wrong to right, right to wrong and wrong to wrong, based on the 3291 changes they found. And here is what they found:

Answer changeNumbers%
Wrong to right169051
Right to wrong83825
Wrong to wrong76323

An important statistic is that about 79% of the students changed their answers. It is significant because, when asked separately, 75% of the students believed that the original choices were more likely to be correct in situations of uncertainty.

Switching to the wrong hurts

The level of fear or shame on a decision to shift from right to wrong overwhelms the misery of failure by sticking to the incorrect one, even though the data showed the advantages the second thinking brings. In a subsequent study, the team asked 23 students of the University of Illinois asked which of the outcomes would hurt them most – 1) you made a switch from a correct answer to a wrong and 2) you did not move away from the initial instinct after considering the eventually correct answer. The response from the majority of respondents suggested that people who were in the first situation regretted it more than the second.

[1] Counterfactual thinking and the first instinct fallacy: Justin Kruger, Derrick Wirtz, Dale T Miller
[2] Our first instinct is far too often wrong: FT

First Instinct Fallacy Read More »

The q-q Plot: The Method

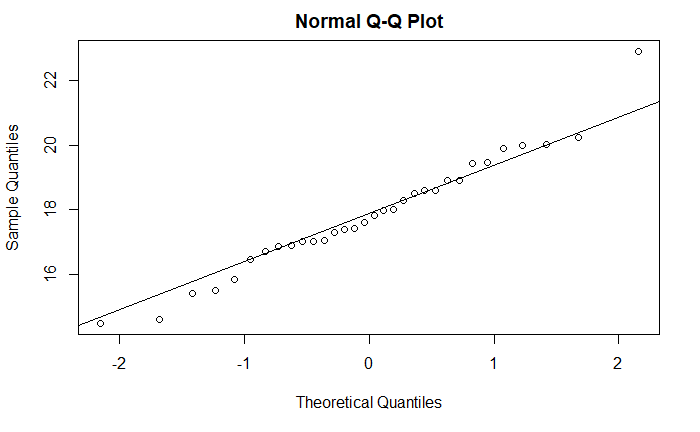
Making a q-q plot is easy in R. Get data, and type a single line command; you’re ready. I will show you the process and the output using the famous mtcars dataset, which is in-built in R. For example, if you want to know the data, qsec, which is 1/4 mile time, of 32 automobiles follows a normal distribution, you type.

qqnorm(mtcars$qsec)
qqline(mtcars$qsec)

These functions are from the stats library. The first line makes the (scatter) plot for your sample, and the second one ( qqline()) makes the line representing the theoretical distribution line, which makes it easier to evaluate whether the points deviate from the reference line.

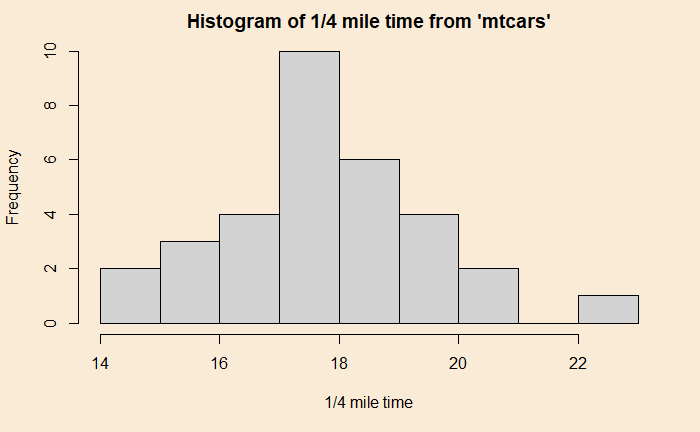
You can see that the qsec data is more or less uniformly distributed, something you may see from the histogram of the data below.

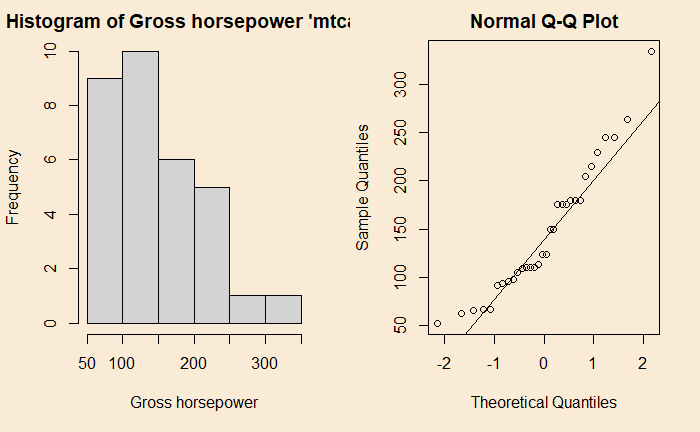
Take a different data which is left-skewed, such as hp, and its qqplot

The q-q Plot: The Method Read More »

The q-q Plot: The Codes

It took quite some time and online help to get some of the R codes to generate the analysis of the last post. So let me share them with you.

The Data

The data was generated using the rnorm function, which is a random number generator using a normal distribution. The following lines of codes generate 10,000 random data points from a normal distribution, with an average of 67 and a standard deviation of 2.5, add them to a data frame, and plot the histogram.

theo_dat <- rnorm(10000, mean = 67, sd = 2.5)
height_data <- data.frame(Height = theo_dat)
par(bg = "antiquewhite")

hist(height_data$Height, main = "", xlab = "Height (inch)", ylab = "Frequency", col = c("grey", "grey", "grey", "grey", "grey", "grey", "grey","grey","brown","blue", "red", "green"), freq = TRUE, ylim = c(0,2000))
abline(h = 2000, lty = 2)
abline(h = 1500, lty = 2)
abline(h = 1000, lty = 2)
abline(h = 500, lty = 2)

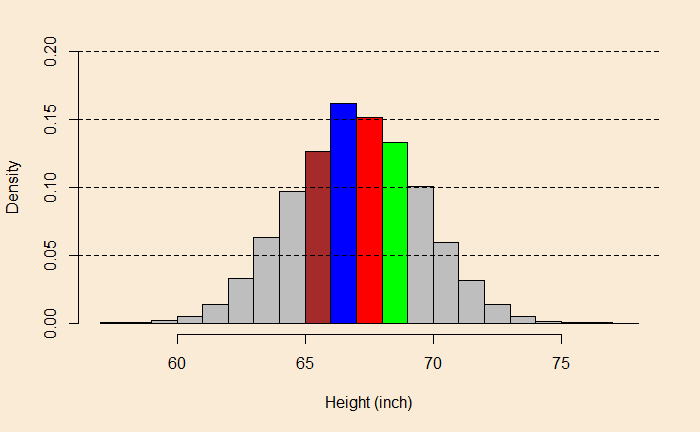
Horizontal lines are drawn to mark a few reference frequencies, and the option freq is turned ON (TRUE), which is the default. On the other hand, the density plot may be obtained by one of the two options: freq = FALSE or prob = TRUE.

par(bg = "antiquewhite")
hist(height_data$Height, main = "", xlab = "Height (inch)", ylab = "Density", col = c("grey", "grey", "grey", "grey", "grey", "grey", "grey","grey","brown","blue", "red", "green"), prob = TRUE, ylim = c(0,0.2))
abline(h = 0.2, lty = 2)
abline(h = 0.15, lty = 2)
abline(h = 0.1, lty = 2)
abline(h = 0.05, lty = 2)

quantile function (stats library) can give quantiles at specified intervals, in our case, 5%.

quantile(height_data$Height, probs = seq(0,1,0.05))
0%5%10%15%20%25%30%
57.8862.87 63.80 64.3764.8765.3165.69
35%40%45%50%55%60%65%
66.0569766.3766.6966.9867.2967.6267.97
70%75%80%85%90%95%100%
68.3169.1069.5668.7070.1571.0677.55

A bunch of things are attempted below:
1) The spacing (breaks) of the histogram bins as per quantiles
2) Rainbow colours for the bins are given to the bins
3) Two X-axes are given one 2.5 units below another

vec <- rainbow(9)[1:10]
vic <- rev(vec)
mic <- c(vec,vic)
lab <- c("0%", "5%", "10%", "15%", "20%", "25%", "30%", "35%", "40%", "45%", "50%", "55%", "60%", "65%", "70%", "75%", "80%", "85%", "90%", "95%", "100%" )

par(bg = "antiquewhite")
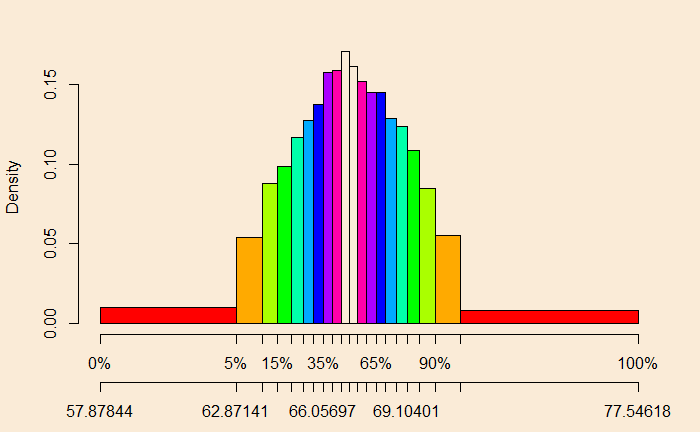
hist(height_data$Height, breaks = quantile(height_data$Height, probs = seq(0,1,0.05)), col = mic, xaxt = "n", main = "", xlab = "", ylab = "Density")
axis(1, at = quantile(height_data$Height, probs = seq(0,1,0.05)) , labels=lab)
axis(1, at = quantile(height_data$Height, probs = seq(0,1,0.05)), line = 2.5)

Note that the 10th bin (from the left came out with no colour as we selected 9 from the rainbow and 10 total array elements for the colour vector.

The q-q Plot: The Codes Read More »

The q-q Plot: Episode 1

The Quantile-Quantile (q-q) plot is a technique for verifying how well your data compares with a given distribution. Quantiles are regular intervals for cutting a probability distribution into equal probability pieces. We have seen before about percentiles, Px, the value below which x percentage (100 portions) of the data lies, and quartiles, which divide the distribution into four equal parts of 25% each (first, second, third, and fourth quartiles).

Distribution

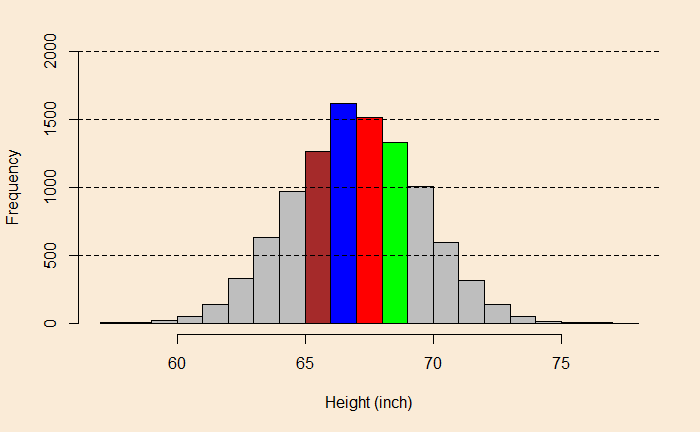
Imagine you collected 10,000 sample data for a parameter, say the height of 10000 adult males, and made a histogram.

You can see that the X-axis describes the height (in inches). Each bin (bar) is one inch wide (X-distance). This is how you interpret the plot: say, the red bin starts at 67, ends at 68, and has a height of 1500 in frequency. This would mean that about 1500 individuals (out of the 10,000) are 67 to 68 inches tall. Similarly, from the brown bucket, there are ca. 1300 males between 65 and 66.

The same graph may be represented with density on the Y-axis instead of frequency.

Using density, we rescale the frequency so that the total area under the curve becomes one, and each bin will provide probabilities of occurrence. For example,

1 x 0.16 + 1 x 0.15 + 1 x 0.125 + 1 x 0.13 + 1 x 0.1 + 1 x 0.1 + 1 x 0.06 + 1 x 0.06 + 1 x 0.025 + 1 x 0.025 + ... = 1

Plot against the quantiles

So far, we have used equal quantity for the parameter (height) on the X-axis. We will change it to something different. We will take percentage intervals (a type of quantile). We use 5% intervals, and the height values corresponding to each of the 5% occurrences are tabulated:

0%5%10%15%20%25%30%
57.8862.87 63.80 64.3764.8765.3165.69
35%40%45%50%55%60%65%
66.0569766.3766.6966.9867.2967.6267.97
70%75%80%85%90%95%100%
68.3169.1069.5668.7070.1571.0677.55

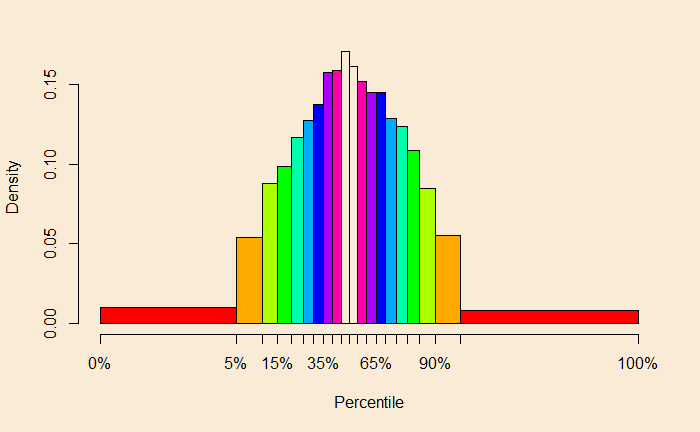
Key observations are 1) the distance between 0 to 5 maybe 5%, but on the scale, it occupies a length of almost 5 inches (62.87 – 57.88). 2) there is an equal probability of observing the value in each group. If you plot the density against the percentiles, we get this:

To understand the second point, equal probability groups, let me add another scale to the X-axis:

Now find the area of any block, e.g. the left red = (62.87 – 57.88) x 0.0093 = 0.046. The next brown = (63.80 – 62.87) x 0.053 = 0.049. Finally, one of the white boxes = (66.98 – 66.69) * 0.17 = 0.049. Now you know the probability groups.

Compare actual with theory

In q-q, you collect the values of various quantiles of your data and plot them against the theoretical quantiles of a specified (normal, chi-squared, etc.) distribution. Since it is theory vs actual, and if they perfectly match, you should get a diagonal straight line.

Before we close

We will do the exercise another time. I will also show you the various R codes used in this post.

The q-q Plot: Episode 1 Read More »

The Ultimatum Game – The Game Theory Version

We have seen what behavioural scientists had observed when carrying out the ultimatum game on their subjects. Ultimatum game also has an economic side theorised by the game theorists for the rational decision-maker. A representation of the game is below.

Unlike the simultaneous games we had seen before, where we used payoff matrices, this is a sequential game, i.e. the second person starts after the first one has made her move. The first type is a normal form game and is very static. The one shown in the tree above is an example of an extensive form game.

The game

Player A has ten dollars that she splits between her and player B. In the game design, A has to make the proposal and B can accept or reject it. If B accepts the offer, both the players get the money per the division proposed by A. If B refuses, no one gets anything.

Backward induction

Although player A starts the game by spitting 10 dollars between herself and player B, her decision gets influenced by what she assumes about B’s decision (accept/reject). In other words, A requires to begin from the ending and work backwards. Suppose player A does an unfair split 9-1 in favour of A. B can accept the 1 dollar or get nothing by rejecting. Since one is better than zero, B will probably take the offer. If A makes a fair split, then also B will accept the 5. That means B will take the offer no matter what A proposes. So player A may choose the unfair path. This is a Nash equilibrium.

What happens if player B makes a threat of rejecting the unfair offer. It may not be explicit; it could just be a feeling in A’s mind. In either case, player A believes in that and thus makes a fair division. And this is what Kahneman learned from his experiments. In-game theory language, the threat from B is known as an incredible threat as it makes no economic sense to refuse even the unfair offer (as 1 > 0)!

References

Games in the Normal Form: Nolan McCarty and Adam Meirowitz

Extensive Form Games: Nolan McCarty and Adam Meirowitz

The Ultimatum Game – The Game Theory Version Read More »