What was the Challenge for the Challenger?
Was the Challenger disaster an avoidable incident, or it’s just a hindsight bias?
On January 28, 1986, seven crew members of the United States space shuttle Challenger were killed when O-rings responsible for sealing the joints of the rocket booster failed and caused a catastrophic explosion.
Machine Learning with R by Brett Lantz
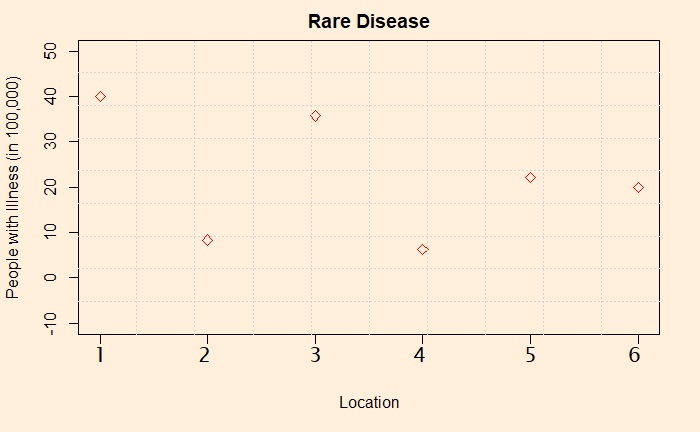
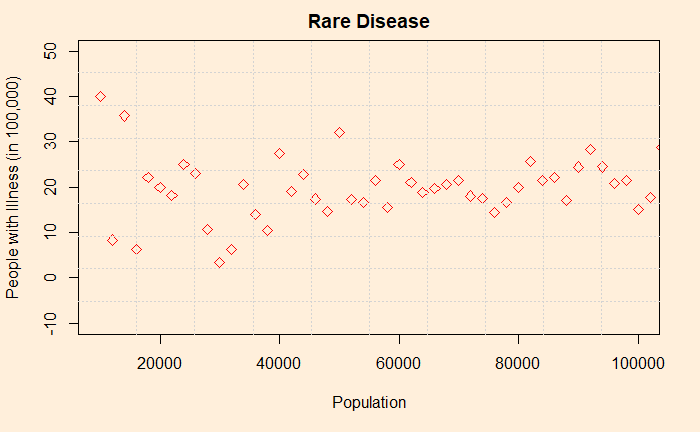
First, look at what data would have been available to the project.
A few scattered points spread over five years, covering 23 previous examples. You don’t need to search for many patterns in this plot; check for any long-term improvements in incident rate (learning over the years). I see none; therefore, the data from 1981 was not outdated for 1986!
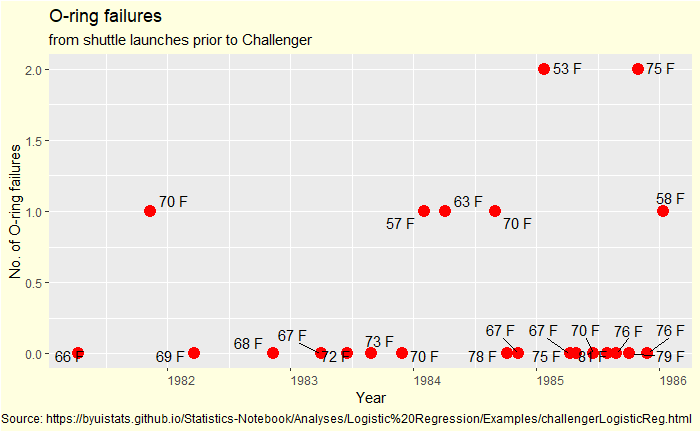
Now we plot it differently – failed O-rings vs outside temperature.
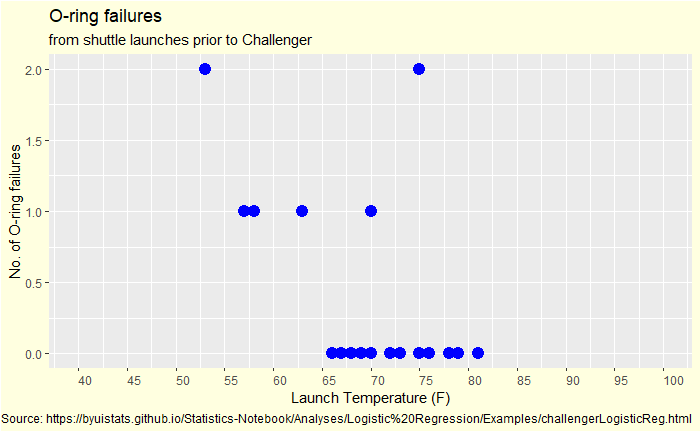
Outside-the-box problem
First observation: no data is available below 50 oF, and the outside temperature at the time of launch tomorrow is 30 oF. You have seen up to 2 out of 6 O-ring failures in the past. How do you know if everything will be alright if you operate so far outside the data limits?
But, how do I know?
A material scientist may have predicted increased brittleness (for the elastomer) with the drop in outside temperature. I would not call it hindsight wisdom as it was science and they have field data (from previous launches) to support it.
A statistician may guess it using Bayesian thinking by choosing the data from the nearest temperature as the prior. That data is at 53 oF, which resulted in 2 O-ring failures.
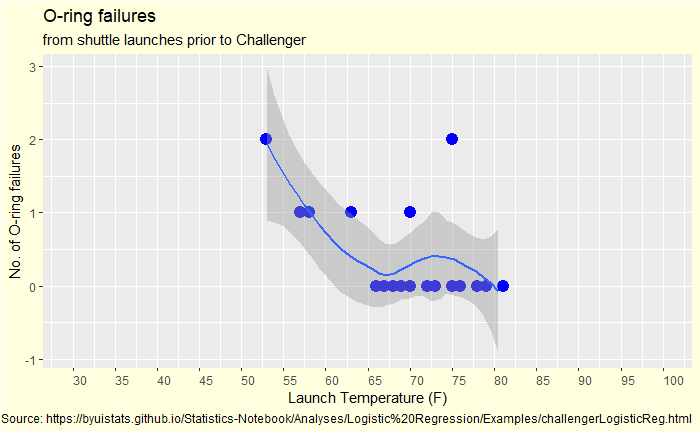
A data analyst would have done an extrapolation starting with a linear fit. And how would that look?
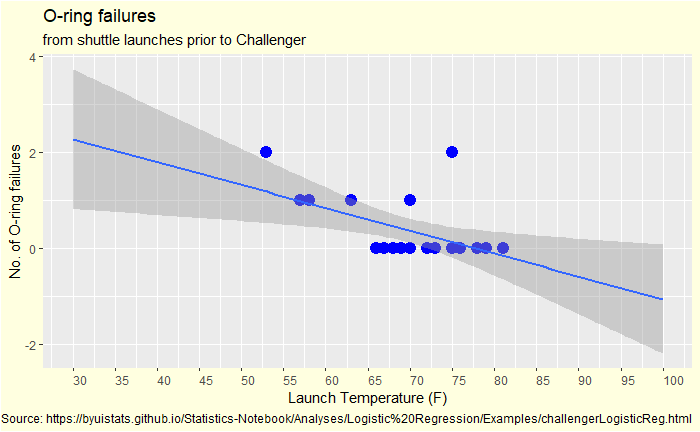
A line that went northwest as the temperature decreased. Or another type of data fit.
What was the real issue?
The Challenger incident was not about data analysis but quality assurance and decision-making. The project leaders had all the necessary information to make the decision and stop the launch, still went ahead and blasted (literally!) the space shuttle, killing all the crew members. It was irrationality of mind. Irrationality fuelled the emotional forces of pride, stubbornness, close-mindedness, and bravado.
What was the Challenge for the Challenger? Read More »