Covid 19 Excess Death – 2

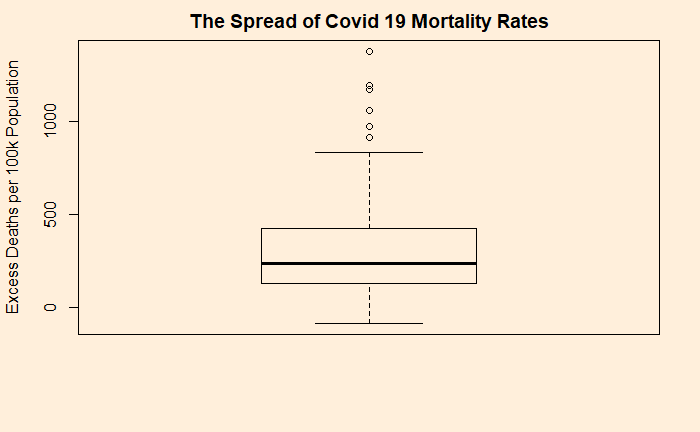
We have already seen how the excess death rates (deaths per 100,000 population) due to covid distributed. The 25th percentile stands at 130 and 75th at 423 (as of 31st December 2021). The statistics of death rates is represented using a box plot.

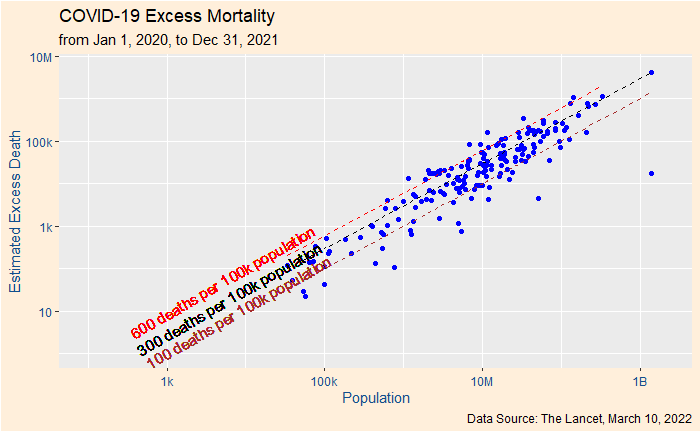
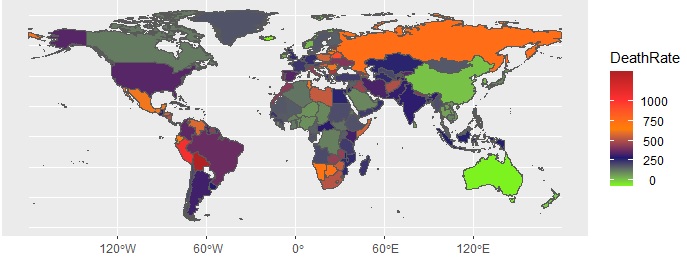
The global distribution of excess death is sketched below:

Case of missed opportunity?

With all the support from hindsight knowledge, let us explore how much of these deaths could have been avoided (perhaps in the next pandemic!). Start with the top performers (the countries in green). These are true outliers and let us not fancy replicating their model. Australia, Newzealand, China, Singapore, Brunei are countries that opted for zero-covid policies, at least until a significant portion of their population received vaccines. They have closed down the countries and regions for the entire 2020 and the majority of 2021.

Bolivia tops the list in terms of excess deaths per million population, at 1376. The numbers have been bad from the beginning, and inadequate restriction measures, thanks to the chaotic political establishment, after the ouster of then-president, Evo Morales, did not help its course. Even today, Bolivia is far behind in vaccination rates.

While the exact reasons why Bulgaria is second in the global death charts is not known, I suppose it was not a coincidence that the country was the least vaccinated in Europe – just 27% by December 2021. For Peru, for instance, the story was poverty, lack of medical supplies, and oxygen. Delta variant and slow vaccinations are cited as the major reasons for the death toll in Russia.

The magenta counties

Brazil may be the model case of what not to do in a pandemic. The pandemic response was lax, and most of the deaths had happened in the first two waves, before the large-scale vaccination programs.

The US is an intriguing example. On the one hand, one can argue that the death rate of around 300 per 100,000 is the limit of what this disease can do with moderate barriers of disease control and a reasonable rate of vaccination. But the question will remain why the country can’t do what its neighbour Canada had managed (115). Spain too belongs to this category and is one of the countries that got battered in the first wave. The reason: no real preparedness as one of the earliest countries (after China and Italy) to hit the virus.

Final word for the country that topped the list of excess death – with about 4 million! India started with one of the most stringent covid measures in the world (shut down of March-May 2020). The country could not cope with the tides of the two waves, one starting from June 2020 and then the delta of 2021, with decent vaccination levels were so far away.

Reference

Estimating excess mortality due to the COVID-19 pandemic: a systematic analysis of COVID-19-related mortality, 2020–21: The Lancet

Covid Response: Bolivia

Covid Response: Peru

Covid Case: Spain

Covid 19 Excess Death – 2 Read More »

Utility and Psychology of Sunk Cost

We have already seen that human decision making is complex and is not always related to the value or the utility of a material (or money). Tversky and Kahneman describe another survey on two groups of people, about 200 people each.

To group #1:
Imagine you paid $10 for a ticket to a play. You reached the theatre and discovered that you had lost the ticket. Will you spend $10 on another ticket?

54% of the people said NO to that question. Apparently, half of the people thought $20 was too expensive for a ticket.

To group #2:
Imagine you went for a play where admission is $10 per ticket. You reached the theatre and discovered that you had lost a $10 bill. Will you spend $10 on a ticket?
88% of the respondents said YES to the purchase.

Same loss, different feelings

The main difference is that, in the second case, the lost dollar was not accounted for the ticket purchase. And $10 on the ticket was a different event unconnected to the loss of $10. I lost a 10 dollar bill due to negligence, but that doesn’t deprive me of watching the play (or it is a good distraction to forget my loss)!.

On the other hand, the re-purchase of the ticket is a painful decision; spending double on a ticket that happened due to my carelessness!

Tversky, A.; Kahneman, D., Science, 1981, 211, 453

Utility and Psychology of Sunk Cost Read More »

Excess Deaths Due to Covid-19

The risk of dying due to Covid was something that we discussed in the past. We observed (in October last year) that the absolute risk of death from covid was about 0.2 – 0.3%. Note that this is not the case-fatality ratio but the chance to die from Covid in a population. These values come from countries that are known for robust death registration systems. Also, the nations that were fully cut off from the rest of the world (e.g. New Zealand, Australia, China) during the first few phases of the pandemic were not considered.

This week The Lancet has published, by far, the most expensive data analysis on excess mortality attributed to Covid 19. Excess mortality is the difference between the number of deaths (all-cause mortality) during the pandemic (observed or estimated) and those expected from the past trends. The data used in the study included all-cause mortality data from various databases (global, regional and country-level) and empirical assessments.

18 million deaths in 2 years

The study reports that 18 million people had lost their life due to Covid in the first two years of the pandemic. That is about three times the official figures. There are about 56 million deaths occur in a year. Therefore, 18 mln in two years represents about 16%.

You can see from the plot that the 100-600 (deaths per 100,000 population) band enclosed most of the countries. The most notable outlier is China which, as per reports, have taken extreme measures to control the disease from spreading. The global average death rate is ca. 290 (without including China).

Another way of expressing the statistics of death rates is using a box plot.

Reference

Estimating excess mortality due to the COVID-19 pandemic: a systematic analysis of COVID-19-related mortality, 2020–21: The Lancet

Excess Deaths Due to Covid-19 Read More »

The Framing of the Risk in Decision Making

We have seen three questions and the public response to those in the last post. While the expected value theory provides a decent conceptual basis, real-life decisions are typically taken based on risk perception, sometimes collected in the utility functions. Let’s analyse options and the popular answers to the three questions.

80% preference for sure $30 vs 80% chance for $45 is a clear case of risk aversion in all forms. People were willing to ignore that 8 out of 10 would get $45 had they given up the $30 in the bank.

Understanding the response to the second question was easy. The first stage was mandatory for the participants to play, and the options in the second stage were identical to the first question.

The intriguing response was the third one. In reality, the second and third questions are the same. Yet, almost half of people who went for the sure-shot $30 are now willing to bet for $45!

Tversky, A.; Kahneman, D., Science, 1981, 211, 453

The Framing of the Risk in Decision Making Read More »

Utility Model in practice

We have seen how a rational decision-maker may operate using either the expected value or the expected utility theory. Real-life, however, is not so straightforward about these kinds of outcomes. In a famous Tversky-Kahneman experiment, three groups were presented with three situations.

1: Which of the following do you prefer?
A. a sure win of $30
B. 80% chance to win $45

2: There is a two-stage game with a 25% chance to advance to the second stage. After reaching the second, you get the following choices, but you must give the preference before the first stage. If you fail in the first, you get nothing.
C. a sure win of $30
D. 80% chance to win $45

3: Which of the following do you prefer?
E. 25% chance to win $30
F. 20% chance to win $45

Expected Values

We will look at the expected values of each of the options. You will argue that it’s not how people make decisions in real-life. But, keep it as a reference. Remember: EV = value x chance, summed over.

CaseEV
A$30
B$36 ($45 x 0.8)
C$7.5 (0.25 x $30)
D$9 (0.25 x $45 x 0.8)
E$7.5 (0.25 x $30)
F$9 (0.2 x $45)
I have highlighted the higher EVs (of the choices) in bold.

What did people say?

In the first group, 78% of the participants chose option A. In the second, it was 74% in favour of option C. It was almost a tie (42% for E and 58% for F) for the final group.

These three problems are, in one way, similar to each other. We will see that next.

Tversky, A.; Kahneman, D., Science, 1981, 211, 453

Utility Model in practice Read More »

Expected Utility Model

To understand the expected utility theory, you first need to know the expected value theory. Suppose I give you this choice. If there is a 100% chance of getting 100 dollars vs a 20% chance of getting 1000 dollars, which one will you choose?

The expected value (EV), which comes from statistics, is the value multiplied by its respective probability and summed over all possible outcomes. So, for the first choice it is: 100 (dollars) x 1 (sure chance) + 0 (dollars) x 0 (no chance). For the second choice, it is 1000 x 0.2 + 0 x 0.8 = 200. Therefore the expected value of the second is double. So shall I go for the second?

That decision depends on risk and utility

The answer is no more straightforward. EV has given you the limit in terms of statistics, that the second choice yields twice the cash, but your decision follows your risk appetite. It is where the expected utility model comes in. The formula now is slightly different: instead of value, we use utility. So what is utility? The utility is the usefulness of the value.

Suppose you badly need 100 dollars, and anything higher is ok but not going to make a difference. Your utility of money might look the following plot.

You may call her someone who desperately needs 100 bucks or a risk-averse person.

On the other hand, imagine she desperately needs 1000 dollars. In such a case, the person will gamble for 1000 bucks even when the chance of winning is only 20%. She is either a risk-lover or has no use for anything short of 1000.

Expected utility model

The expected utility (EU) of the first and the second choices are respectively:
EU1 = U(100) x 1 + U(0) x 0
EU2 = U(1000) x 0.2 + U(0) x 0

In other words, the utility function depends on the person. Suppose, for a risk-averse, it is a square root, and for a risk-lover, it could be a square. Let’s see what they mean.

\\ \text{\bf{for the risk-averse}}, \\ \\ EU1 = \sqrt{100} * 1 + 0 = 10\\ \\ EU2 = \sqrt{1000} * 0.2 + 0 = 6.32\\ \\ EU1 > EU2 \\ \\ \text{\bf{for the risk-lover}}, \\ \\ EU1 = 100^2 * 1 + 0 = 10,000\\ \\ EU2 = 1000^2 * 0.2 + 0 = 200,000\\ \\  EU2 > EU1

Expected Utility Model Read More »

Framing the Risk

We are back with Tversky and Kahneman. This time, it is about decision making based on how the risk appears to you. There is one problem statement with two choices. Two groups of participants were selected and given this but in two different formats.

Here is the question in the first format: imagine that the country is bracing for a disease that can kill 600 people. Two programs have been proposed to deal with the illness – program 1 can save 200 people, and program 2 gives 1/3 probability to save all and 2/3 chance to save none. Which of the two do you prefer? 72% of the people chose program 1.

The second group of participants was given the same problem with different framing. Program 3 will lead to 400 people dying, and program 4 has a 1/3 probability that none will die and 2/3 probability that all will die. 78% of the respondents chose program 4!

Risk aversion and risk taking

Identical problems, but the choices are the opposite! The first case sounded like saving lives, and the players chose what appears to be a risk-averse solution. In the second case, the options sounded like losing lives, and people were willing to take the risk and went for the probabilistic solution.

Tversky, A.; Kahneman, D., Science, 1981, 211, 453

Framing the Risk Read More »

MtDNA Knows It All

You may know that our cell nuclei contain genomic DNA – parts of it possess the codes (genes) that determine all the traits. We obtain this from our parents through some combination.

Enter mitochondrial DNA (mtDNA). It is not your usual type. First, it lies inside mitochondria and not the cell nucleus. Second, it is inherited from the mother alone; fathers do not contribute. Third, it does not recombine. What is so special about this? Well, mtDNA has become the tracer molecule to study relationships between one individual to another.

The absence of recombination and bi-parenting inheritance made these molecules scientists’ pet for tracing the maternal ancestry of human beings. And they traced back thousands and thousands of years and ended up at a single mother who lived ca. 200,000 in Africa. She is called the Mitochondrial Eve. She was not the first human but became the meeting point (common ancestor) when human mtDNAs were all traced back.

MtDNA Knows It All Read More »

The Myth of Benevolent Dictator

The gulf between what we all like to believe and what happens can be wide. We have seen this before in the one-child policy of China. We called it the claim instinct. Because it contained the perfect recipe – a mighty leader, an intervention and results that fitted a narrative.

We look at a similar one today – that of benevolent dictator. The phrase may sound like an oxymoron for anybody who lives in the modern world. The benevolent autocrat is a school of thought on leadership, and its proponents take examples from countries such as Singapore as their test case. As per this school, these well-intended rulers bring higher economic prosperity to their countries.

The paper written by Rizio and Skali examined this claim by collecting data from 133 countries over 150 years starting from 1858. Their mathematical analysis consisted of three variables – rulers (taken from Archigos database), political regime (Polity IV dataset), and GDP per capita (Maddison dataset).

Misguided belief in dictators

The results showed that good dictators brought prosperity no different from what chance would have made. At the same time, bad dictatorships showed a clear negative impact on the economy.

References

S.M. Rizio and A. Skali, The Leadership Quarterly 31 (2020) 101302
Introducing Archigos: A Dataset of Political Leaders
Polity IV Individual Country Regime Trends
Maddison Project Database 2013

The Myth of Benevolent Dictator Read More »

Tiktaalik, the Ancestor that Came out of the Water

If our great grandmother Lucy was the bridge between non-hominins and hominins, Tiktaalik was that extraordinary life that acted as the connection between fishes and four-legged animals. I know it’s not easy to digest that we had fish as our common ancestor!

On the one hand, it was a fish with scales and fins. Unlike the other fishes, Tiktaalik’s fins had bones (corresponds to an upper arm, forearm and wrist) that could enable them to come out from the water and walk. And it had lungs and grills. Above all, Tiktaalik was a fish with a neck.

In his book, the Inner Fish, Neil Shubin, the American palaeontologist and evolutionary biologist, narrates the journey to unearth nature’s best-kept secret for a long time (about 375 million years!) – discovering the missing transitional piece from the life in water to life on land. The possibility of transitional creatures was something Charles Darwin had predicted some 130 years before!

Lucy: wiki
Tiktaalik: wiki
How fins became limbs: nature
A Devonian tetrapod-like fish and the evolution of the tetrapod body plan: nature

Tiktaalik, the Ancestor that Came out of the Water Read More »