How many ways are there to distribute 7 cookies to 4 kids? Here are two things to help you. It is perfectly OK for someone to get no cookie. The cookies are identical. The second property suggests the order in which cookies are given doesn’t matter. Imagine a third child getting two cookies; that can happen in the beginning, mid or at the end.
The problem is solved using the famous ‘stars and bars’ method. Step one is to box cookies into four compartments, each representing a child. Suppose kid 1 gets one, kid 2 gets two, kid 3 gets one, and kid 4 gets three. The representation is:
* | ** | * | ***
The solution to the problem has now become the rearrangement of these stars and bars. Since the order doesn’t matter, it is a ‘combinations’ problem of 10 (7 stars + 3 bars), where three are bars (10C3). It is also 10 possibilities among 7 bars (10C7).
Two friends, Andy and Boris, are making a bet about their neckties, which their spouses gifted them (so they don’t know the price). The bet goes like this: each will call the spouse, and whoever has the cheaper tie wins and gets the other person’s more expensive tie.
Andy reasons that he had a 50/50 chance of winning the bet. If he loses, he loses the value of his tie. If he wins, he wins more than the value of his tie. In other words, there is a 50% probability he loses x and a 50% chance he gets more than x. So, he must wager.
Boris also thinks the same. Obviously, this is impossible, where both men have the advantage in this game.
There is a logical error in their reasoning. The person’s argument of losing x and gaining more than x suggests he thinks he will lose a less expensive tie and get a more expensive tie, which is not correct. Let $20 be the price of a tie and $40 the other. Since each doesn’t know the price at the time of the bet, there are four possibilities with a 25% chance each.
Andy has a $40 tie, and Boris has a $20 tie – Andy’s gain: – $40 Andy has a $20 tie, and Boris has a $40 tie – Andy’s gain: + $40 Andy has a $40 tie, and Boris has a $40 tie – Andy’s gain: 0 Andy has a $20 tie, and Boris has a $20 tie – Andy’s gain: 0
The expected value is: 0.25 x -40 + 0.25 x 40 + 0.25 x 0 + 0.25 x 0 = 0. The same goes for Boris.
The term ‘middle class’ is ubiquitous in economics, sociology and politics. Yet, most of the receivers don’t know what it means! The term originated as a requirement to fill the void between the wealthy upper class and the poor lower class. We attempt to understand the concept quantitatively and will use a US viewpoint.
There is no single definition for the household income range required to qualify as middle-class. The first approach was to form intuition about middle-class income. Because of this, it varied from individual to individual. To some, it was $24,000 to $96,000, whereas to others, it was $20,000 to $200,000.
The second method was to divide into income quintiles (5 sets of 20%) and give the top 20% to the upper and the bottom 20% to the lower class. The remaining (middle) three quintiles (20% to 80%) are middle class.
Pew Research Center follows a different definition. It takes the median national household income for a family of four and constructs the middle-class income range to be between 67% and 200% of it. For example, if the median household income is $70,000, the middle class becomes between $47,000 and $140,000. But why is it shrinking?
The Pew Research Center found that between 1971 and 2021, the middle income decreased from 61% to 50%. Below is a closer view of the data.
Median Income of households
1971
2020
% increase
Upper-income
$130,008
$219,572
69%
Middle-class
$90,131
$59,934
50%
Lower-income
$20,604
$29,963
45%
The data suggests that the growth rate of the upper class was faster, and the lower class was slower than the middle. This would mean expansion of the top and bottom brackets, naturally, at the expense of the middle.
Share of adults
1971
2020
Upper-income
25%
29%
Middle-class
61%
50%
Lower-income
14%
21%
References
Middle Class: Wiki How the American middle class has changed in the past five decades: Pew Research Center Steven Pressman, Defining and Measuring the Middle Class, Working Paper 007, American Institute of Economic Researcher.
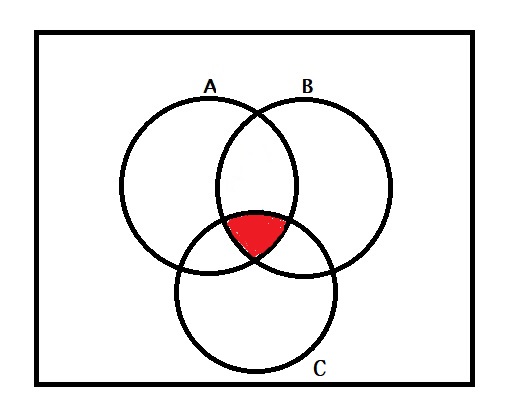
We have seen one extreme of the AND rule of probability, where people forget to realise how the conjunction makes events rarer. A well-known case is Linda’s problem. Here is the pictorial representation of the AND rule, which combines three events.
The shaded region shows the joint probability of A, B, and C. As the number of events increases, the ‘common area’ shrinks. There is another extreme case of conjunction fallacy, typically used by journalists. Read the following title that appeared in CBS Sports.
Cavaliers win first playoff series without LeBron James since 1993 by taking Game 7 over Magic
The writer has combined Cleaveland’s playoff entry, the first-round victory, and Lebron’s absence, making it a ‘rare’ sensational event.
1. Is this the first playoff entry? No, this young Cavaliers team has been playing well. They were also in the playoff last season (2022–23) but lost against the Nicks. 2. So this must be the first series win (ever)? No, they have recently made four consecutive NBA final appearances (2014-15, 2015-16, 2016-17, 2017-18). Note that these are not just one series victory; we are talking about championship finals—four times! 3. But this happened after a long time? No, the team won the first rounds in 2007-08, 2008-09 and 2009-10. 4. Then, how can I make it a rare event? Find things in common and start subtracting them. Win, Lebron, Decade, the list goes on.
Adam finishes work at random times between 3 PM and 5 PM. His mother lives uptown, and his girlfriend lives downtown. After work, he goes to the metro station, catches the first train in either direction and has dinner with the person who lives on the side he reaches. His mother complains that his son came only two times in the last twenty working days, whereas Adam thought he was fair, with either party getting 50-50 chances. What’s really happening?
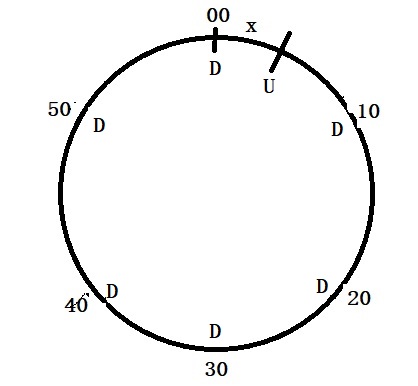
Suppose the metro on each side runs every 10 minutes, making it six times an hour: 3:00, 3:10, 3:20, etc. Let D represent the metro to downtown and U to uptown at x minutes after D.
Since the mother saw him only twice in twenty days, the probability of Adam catching the uptown metro is 2/20 = 1/10, which must be equal to x/10. This implies x = 1. So the metro that goes uptown reaches its stop at 3:01, 3:11, 3:21, etc.
Reference
Fifty Challenging Problems In Probability: Frederick Mosteller
There are two urns: Urn 1 contains two red balls and one black ball, and Urn 2 has 101 red balls and 100 black balls. Two balls can be taken from one of the urns at random. The task is to correctly identify the urn from which the balls have been collected. After the first draw, you can decide whether to replace the ball. What will be your strategy?
If the first ball is red, the remaining balls in Urn 1 are one red and one black, and in Urn 2, 100 red and 100 black. That means the probability of drawing any colour is equal (0.5) from each urn. As this can’t help deciding the correct urn, return the red ball and pull the second ball.
If the first ball is black, the remaining balls in Urn 1 are two reds and zero black, and in Urn 2 are 101 red and 99 black. In such a case, do not replace the ball, as the probabilities of red and black are different in each urn, which helps identify the urn better.
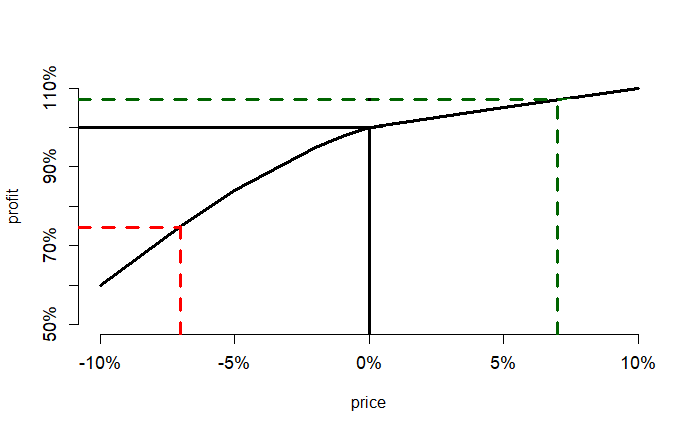
Let’s apply Jensen’s Inequality to the housing market. It concerns default rates on housing loans with the housing prices. When the housing prices are high, the defaults reduce; when the prices are lower, defaults increase but not in the same magnitude. Here is a fictitious plot of % of bank profit vs % change in housing price.
A 7% increase in house price increases the bank’s profit by about 7%, whereas an equivalent decrease in price leads to about a 25% drop in profit!
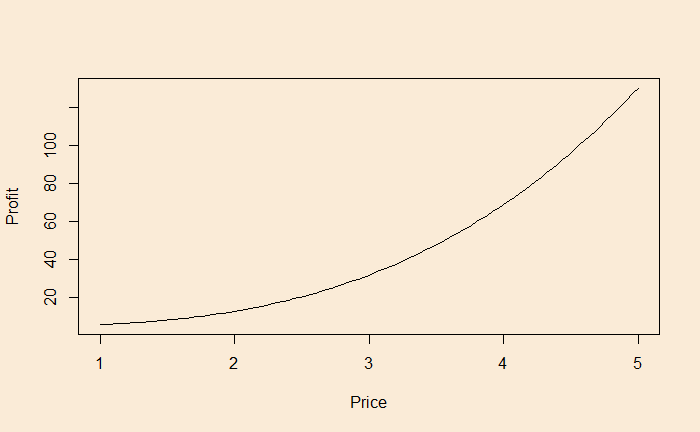
Before analysing inequality, let’s develop an intuition. Suppose the profit from sales of an object moves the following way with the price.
The price can be 2, 3, or 4 in a given year with equal probabilities. What is the average profit?
The mathematical function that presents the above behaviour is x3 + 5. Suppose the price values (x) 2, 3, and 4 can occur equally likely. This means the average price value is (2+3+4)/3 = 3. The profit at x = 3 is 33+5 = 32.
Let’s estimate the profit at each x value and then take the average. at x = 2, profit = 23+5 = 13 at x = 3, profit = 33+5 = 32 at x = 4, profit = 43+5 = 69 Average is (13+32+69)/3 = 38
This is Jensen’s inequality, which says that the average (expected values) of inputs do not lead to average output if the function is non-linear. Depending on the shape of the non-linearity, it can under-estimate or over-estimate.
An aircraft has 200 seats. The airline knows that, on average, 5% of the people who have purchased the ticket don’t show up. What is the maximum number of tickets they can sell to manage the probability that more than 200 passengers will show up at 10%?
The number of people who do not show up (X) will follow a binomial distribution with a probability of success of 5%, X ~ Bin(200+X, 0.05). Since X is unknown, we first use the qbinom function on 200 to get an approximate solution.