March 2023

Road Safety in India – Survival rate

In the final episode of accident data analysis, we will go into the remaining key stats – injuries and fatalities – and postulate a potential problem with the interpretation, i.e. data registration. But first, a plot of the number of injuries per population.
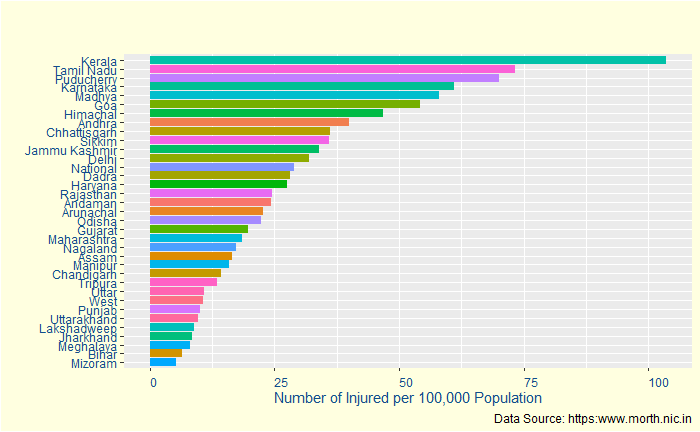
Kerala is now 33% more than the nearest rival, almost suggesting it is the most dangerous state for a passenger. But is that entirely true? Let’s see the following statistic – the fatalities per 100,000 population.
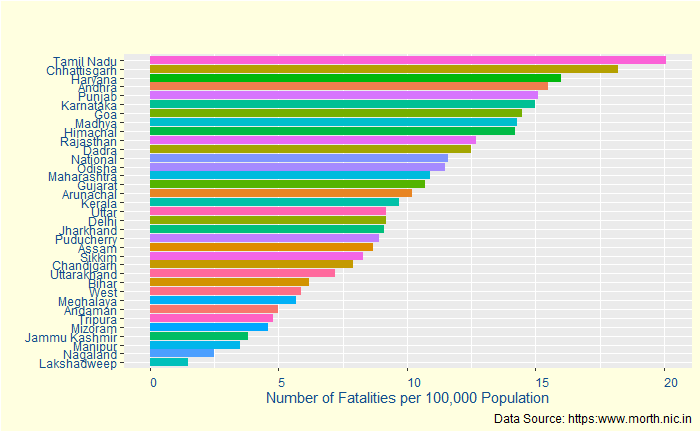
Strangely, it moves down to the 16th. Puducherry, which is third in injuries, also goes down. To understand this better, let’s define survival rate = the number of injured / (number of injured + number of dead).
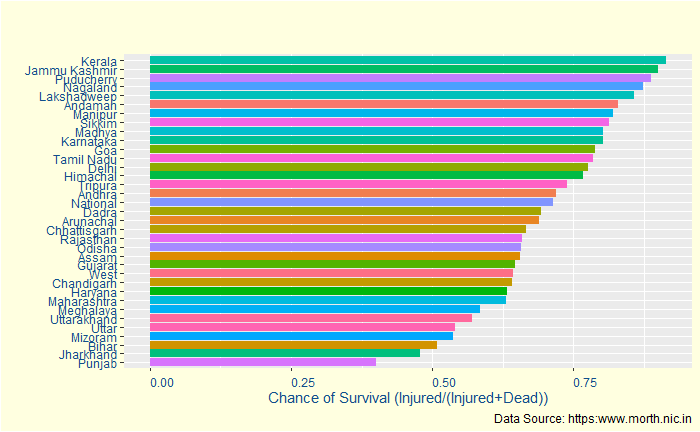
Yes, Kerala has a > 90% survival chance after an accident. It may indicate a few things:
1) Kerala has better accident care for the injured (that prevents them from dying)
2) Kerala has more proportion of low-intensity accidents compared to other states
3) Kerala’s registration system is more thorough in recording incidents. And higher survival rate is an artefact of having a higher reporting rate of all incidents, however minor it could be.

Not so fast

When you are about to conclude data collection, here is another one: the proportion of grievously injured people among the total Injured.
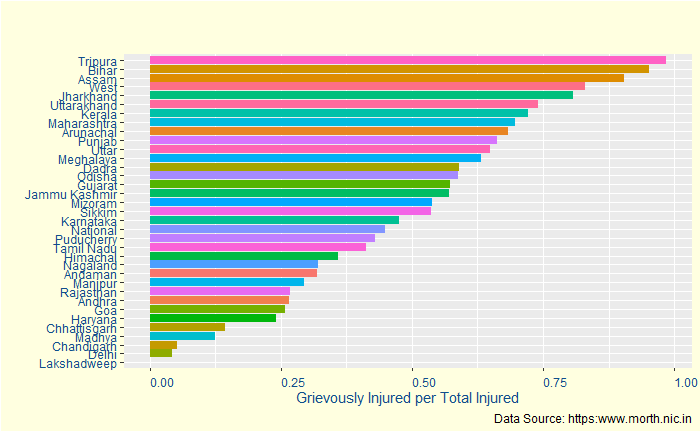
Almost 75% of the injured are seriously injured. So to conclude, Kerala remains one the most dangerous for road safety, but most of the injured are somehow saved, despite the severity.

Road Safety in India – Survival rate Read More »
Road Safety in India – Dangerous States

One of the rather unfortunate aspects of statistics is that it doesn’t say why something has happened. They also can’t reveal data quality, making it difficult to compare different entities. Therefore, it leaves the burden of interpretation in the hands of the (responsible) reporter. Not always a desirable combination! With this introduction, let’s continue with the road safety data. This time we go deeper into state-level statistics.

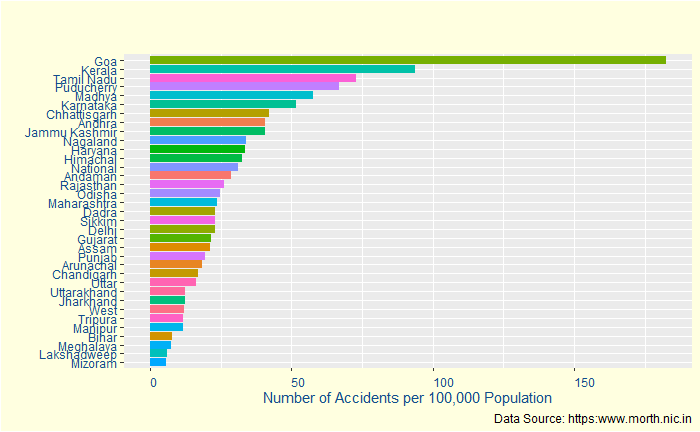
Number of Accidents

Does this make Goa the most accident-prone region? Not necessarily. It is one of the smaller states in India with about 1.4 mln population. The same goes for Puducherry, at number four, with a quarter of a million. If you want to know the difficulties of interpreting data from a smaller population, read this post. Another factor is the incident reporting system. It may not be a coincidence that the top four regions are also known for better data recording, with the three among the four (Kerala, Goa and Puducherry) at the top-5 of the human development index. We’ll come back to this a bit later.

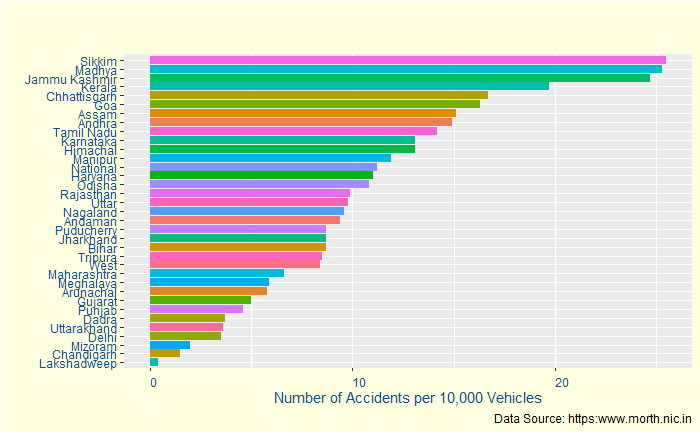
The same statistics on a different basis – the number of accidents per 10,000 vehicles – are below:

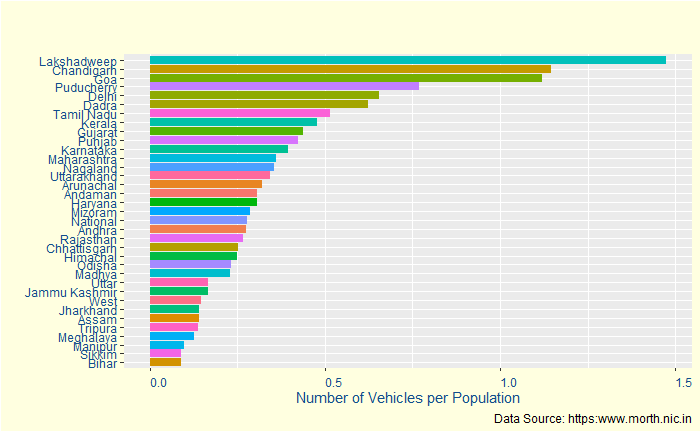
Before we move on: let’s try and understand if we can explain the top candidates based on their vehicle per population density. For that, we divide accidents per 100,000 population with accidents per 10,000 vehicles and divide by 10.

Yes, the top regions (Sikkim, Madhya Pradesh and Jammu & Kashmir) of the previous plot are way down in this plot. Again the statistics of smaller samples. That leaves one curious entity that we haven’t addressed so far – Kerala, which is among the top so far, not so small in population (33 million) or in vehicle density (~ 0.5). More about this coming up next.

The R code used for building the plots is below:

state_data %>% 
  ggplot(aes(x=reorder(State, Acci_per_Pop), y=Acci_per_Pop, fill = State)) + 
  geom_bar(stat = "identity") +
  geom_col() +
  coord_flip()

HDI of Indian States: Wiki

Road Safety in India – Dangerous States Read More »

Road Safety in India

One of the reasons statistics have a poor reputation in society is the way commentators tell incomplete stories. Typically, data can hold multiple layers of truth; not all are evident from the descriptions. In the next few posts, we will try and understand how road safety has performed in India in the last 50 years.

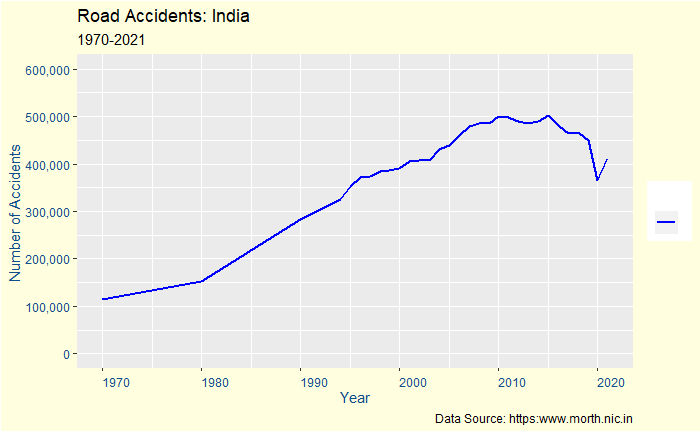
Road Accidents

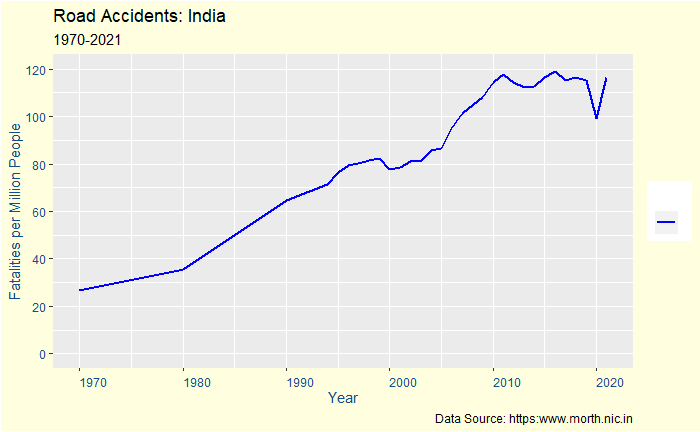
It’s been increasing but showing a little turnaround in the last decade.

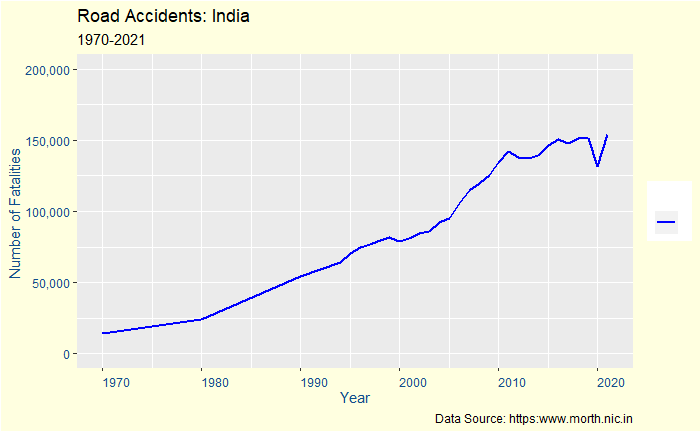
The Number of Fatalities

Surely, the numbers are stabilizing but not decreasing. We need to go deeper into any confounding effects, such as population change or any growth in the number of vehicles.

Risk to a person

So, the risk to an average person remains high though it has stabilized in recent times. The next question is if road travel has become more dangerous.

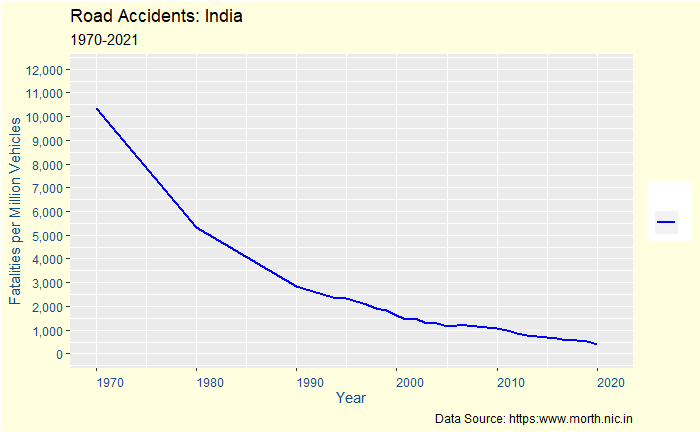
Risk to a passenger

In the basic sense, it is just a reflection of the exponential growth of vehicles – the base or denominator – in the last few years. In other words, the threat to life has not increased proportionally to the increase in the number of vehicles. One can also argue that automobiles are becoming better in safety performance.

Road Safety in India Read More »

Subscribing Irrationality

We have seen the role of expected values as a rational means of making decisions. Or the expected utility in other cases. But life is not as simple as in the case of a textbook example. And life never presents situations such as betting on a number of a die or an 80% chance of $45 vs a sure-shot $30, where someone can estimate the value arithmetically. It gives options on products with price tags. But how the value of a product is visible to the decision-maker?

The author, Dan Arie, discusses this dilemma and concludes that most humans like to have a reference and use a value based on relativity. Be it the price of a meal or television – we need something to relate to before choosing an option. And the sellers know that very well and try to use it in pricing their products. Here is one possible example I encountered this morning – the subscription offers of The Atlantic magazine.

Select your plan

First, the big picture: here is what you see on the website:

There are three options: online, online + print and online + print + something else! We shall come to that something else sometime later. Imagine if the choice was between the two options, digital and digital + print:

As seen in various studies, the aspiring subscriber makes a comparison a may go for the second most expensive option. She may further justify her action for the online version as a new way of working in the digitalised world.

It is more expensive – thrice the difference between the first two
Visibly distinct – three-digit whole number vs two-digit factions with deception (e.g. 79.99 sounding 70 instead of 80)
It has repeated mentions of the word ‘free’: likely a lure for the emotional few.

Let’s do a few hypothetical calculations to demonstrate the expected value (to the seller).

Case 1: two options – 80% for option 1 and 20% for option 2. The seller’s earnings per subscription = 0.8 x 80 + 0.2 x 90 = 82.
Case 2: three options and no ‘free’ – 60% for option 1 and 40% for option 2. Earnings per subscription = 0.6 x 80 + 0.4 x 90 = 84.
Case 3: three options and ‘free’ – 60% for option 1, 30% for option 2 and 10% for option 3. Earnings per subscription = 0.6 x 80 + 0.3 x 90 + 0.1 x 120 = 87.

Dan Ariely, Predictably Irrational

Subscribing Irrationality Read More »

Hypergeometric Distribution – Picking Without Replacement

‘Picking without replacement is the key phrase to understanding hypergeometric probability distribution. Here is another example, 30 names, 10 girls and 20 boys, are put in a sorting hat, and the top five are randomly selected for top prizes. What is the probability that four girls and one boy will win the honours?

Needless to say: it is a game without replacement. We know how to do such problems, as we have done a few earlier using combinations formula. Multiply combinations of picking 4 boys from 10 with 1 girl from 20 and divide by the total combinations – of 5 from 30.

\\ P(\textrm{4 boys and 1 girl}) = \frac{_{10}C_4 \textrm{ }*\textrm{ } _{20}C_1\textrm{ }}{_{30}C_5}

(10!/(4!6!)) x (20!/(1!19!)) /(30!/(5!25!))
= (10 x 9 x 8 x 7 / 4 x 3 x 2) x (20) / (30 x 29 x 28 x 27 x 26 / 5 x 4 x 3 x 1)
= (5 x 4 x 3 x 2 x 20 x 10 x 9 x 8 x 7) / (4 x 3 x 2 x 30 x 29 x 28 x 27 x 26)
= (5 x 10 x 2 x 7) / (3 x 29 x 7 x 3 x 13)

choose(10,4)*choose(20,1) / choose(30,5)

Or simply,

dhyper(4, 10, 20, 5, log = FALSE)

There is a 2.95 % (0.02947244) chance that it can happen this way!

Hypergeometric Distribution – Picking Without Replacement Read More »

Hypergeometric Distribution

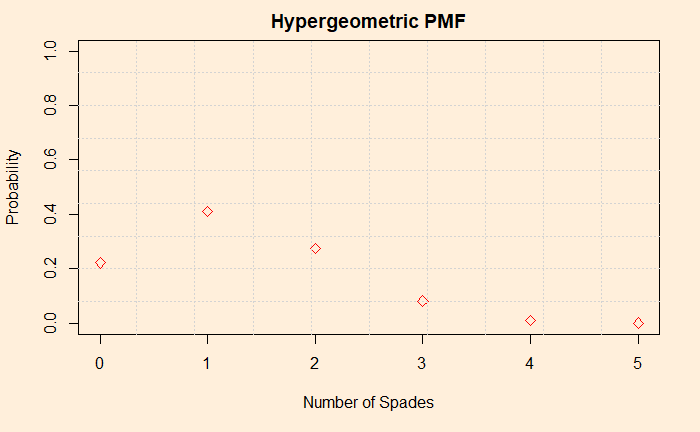
Hypergeometric Distribution is a discrete distribution best suited for estimating probabilities of card playing. For example, what is the probability distribution of spades in a five-card poker hand? Before getting into the formula, we’ll see how R estimates it.

dhyper(x, m, n, k, log = FALSE)

For zero occurrence of spades after drawing five cards without replacement,
x: number of spades = 0
m: number of spades in the deck = 13
n: number of other cards in the deck = total cards – m = 52- 13 = 39
k: number of cards drawn from the deck = 5

dhyper(0, 13, 39, 5, log = FALSE)

Here is the distribution in a five-hand poker hand.

Hypergeometric Distribution Read More »

The Arizona DNA Problem

If there is a 7.5% chance that two people share one spike (locus) of DNA, what is the chance two people share nine loci? Well, let it be (7.5/100)9 = 7.5 x 10¹¹ or 1 in 13 billion! So a decent case for DNA match as forensic evidence!

Now the twist, an Arizona laboratory reported about 100 matches with nine loci of DNAs in a database of just over 60,000 samples. How is that possible? The first (1 in 13 billion) was an estimate, and this is data. So the estimation must be wrong by a zillion miles, right?

If you recall the birthday problem, you may realise this can’t be dismissed without further enquiry. Let’s start

Suppose there are 60,000 samples. What is the number of distinct pairs that can form from 60000? It is 60000C2 = 60000 x 59999 / 2 = 1,799,970,000. For each pair, how many ways to match 9 out of 13 loci? It is 13C9 = 13!/(4! x 9!) = 715. So the total number of 9 loci match = 1,799,970,000 x 715 = 1.286979 x 10¹².

If the chance of 9 local matches of one pair is 1 in 13 billion, then the number of matches possible in 1.286979e+12 pairs is 1.286979 x 10¹²/13 x 109 = 99.

The Arizona DNA Problem Read More »

Coherent Arbitrariness

What determines the price of an object? If you are buying an asset, it could be the present value of all cash flow from it. It could also be the meeting point between supply and demand curves (or the willingness to pay and marginal cost). Well, there is another factor – human irrationality.

Ariely et al. call it coherent arbitrariness induced by the anchoring effect. In one of their studies, the experimenters selected 55 students of the Sloan School MBA program and tried a bidding game for six products. The experimental design was as follows.

The researchers described six products – wines, chocolates, books and computer accessories. The students need to do the following:
1) Write down the last two digits of their social security (SS) number on top of the paper.
2) Write down the same number (SS) against each item and indicate their choice (as accept/reject) if it was the price of the product in dollars.
3) Write down the maximum willingness to pay for each item.

The results are in the following table. The values with the dollar sign represent the average willingness to pay mentioned by the subjects.

Last 2 digits of SS –> 00-1920-3940-5960-7980-99
Cordless
trackball
$ 8.64$11.82$13.45$21.18$26.18
Cordless
keyboard
$16.09$26.82$29.27$34.55$55.64
Average
wine
$ 8.64$14.45$12.55$15.45$27.91
Rare
wine
$11.73$22.45$18.09$24.55$37.55
Design
book
$12.82$16.18$15.82$19.27$30.00
Belgian
chocolates
$ 9.55$10.64$12.45$13.27$20.64

Look at how the average willingness to pay changed with the anchor (person’s social security number)!

Dan Ariely, George Loewenstein, Drazen Prelec, The Quarterly Journal of Economics, February 2003

Coherent Arbitrariness Read More »

Inadequate Moral Positioning on Charity

Peter Singer’s 1972 paper, “Famine, Affluence and Morality,” challenges some of the fundamental premises of our moral positioning. He argues how timely actions can reduce the sufferings of the disadvantaged and challenges the common knowledge of helping others as supererogatory rather than obligatory.

The backdrop of Singer’s paper was the suffering of the millions in East Bengal in 1971. In this view, charity and generosity are unacceptable terms to describe the act of helping people facing death due to lack of food, medicine and shelter. Because of this notion, a person who does charity is praised, but the one who avoids it is not condemned – something Singer despises severely.

Singer argues that humans are obliged to prevent a wrong from happening, whether it’s in the neighbourhood or an unknown land. To quote his famous example of a drowning child,

if I am walking past a shallow pond and see a child drowning in it, I ought to wade in and pull the child out. This will mean getting my clothes muddy, but this is insignificant, while the death of the child would presumably be a very bad thing.

Peter Singer, Famine, Affluence, and Morality, Philosophy & Public Affairs 1 (3), 1972, 229.

This act of saving the child is not just praiseworthy; it is required.

To summarise, Singer challenges our moral positioning about charity. His idea, one way or another, paves the foundation of genuine altruism (as a moral requirement) in society. His views are twofold: 1) it recognises contributions of affluent people as mandatory, and 2) it rejects the lack of proximity of the needy as an excuse not to help.

Inadequate Moral Positioning on Charity Read More »

Missing Jimmy Stewart and SVB’s Crisis

We have seen coordination failure and its consequence in bank runs and what might have happened at Silicon Valley Bank last week. Two videos on YouTube (A and B) have prompted me to write this post. Video A is about a CEO who just managed to pull out her money from the bank before the collapse, an event partly transpired by actions such as hers. The second video shows the pivotal moment from the movie, “It’s A Wonderful Life” (1946), where the hero James Stewart single-handedly prevented a bank from collapsing. Real heroism!

Bank’s decision making

So what happened at the 2023 bank scene? SVB held large quantities (in the order of $200B) of deposits from start-up companies. The bank keeps the required minimum cash or fractional reserve banking, typically about 10%, in their vaults; the rest is turned around to make profits (earning from the investing – the interest paid to the depositor). SVB has invested ca. $90B of its cash in what is known as held-to-maturity (bonds). There is nothing wrong so far, as these instruments are pretty risk-free, but not this time! The bank invested its money at ca. 2% return for about four years in 2021, and the Federal Reserve raised the interest rate a year later, making a heavy dent in the current market value of the 2021 investment.

Meanwhile the investors

Two things happened at the investor’s end. The depositors (the technology companies) wanted to take out more money from the bank as the funding started declining for the firms. The news of the declining fair value of the 90 billion bonds became public with the annual report. The second news made the depositors and their seed investors nervous; they wanted to withdraw all their money.

Perfect storm

The end result was a perfect bank run. On March 10, the bank announced they had failed to raise capital and were looking for a buyer. A few hours later, the bank was shut down by the regulator.

The math behind the trouble

Imagine the bank had bought treasury bonds worth $100 in 2021 for four years at a rate of return of 2%, and the Fed raised the interest rate to 5% immediately after that. If the bank waits for four years, it will get 100 x (1.02)4 = 108.2 at 2% returns. If the bank wants to encash before, it must go to the secondary market to sell. The buyer at the secondary market, who can now get 5% returns on a bond, therefore, will value the bank’s bonds at $88 (108/(1.05)4).

The psychology behind the trouble

But the math is just a catalyst to the trouble. The broader issues are the decision-making by the bank that invested significant cash in long-term bonds (duration risk). And the depositors, triggered by their investors, wanted to withdraw their money all at once (irrationality). And alas, the Jimmy Stewarts, who could charm the depositors from carrying extreme actions, exist only in movies and textbooks.

Further Watch

A) CEO describes pulling money from bank hours before collapse: CNN
B) Bank Run Scene from “It’s A Wonderful Life” (1946): Ian Broff
Why Banks Are Collapsing: Graham Stephan

Missing Jimmy Stewart and SVB’s Crisis Read More »