February 2023

Arrangement Problems

The distribution of objects into boxes is a classical statistics question, which I find very hard to understand. For example, the number of ways a person can distribute 36 chocolates among five kids in which nobody gets fewer than 5.

Let’s start with the concept of arrangements as permutations of objects and partitions. How many ways to distribute n balls into k boxes when the balls are distinguishable, and the order doesn’t matter? The following picture illustrates this question for n = 5 and k = 5.

From the picture, you may envisage the problem as the arrangement of 5 different (distinguishable) coloured balls and four similar (indistinguishable) partitions — a set up of 9 objects. If you get this concept clear, life becomes simpler.

The total possible arrangements are nothing but a distribution of n + k – 1 objects with k -1 items that are similar. Mathematically it is

(n + k – 1)!/(k – 1)!

Naturally, if the balls are indistinguishable, you will have to divide the term with n!

(n + k – 1)!/[(k – 1)! n!]

And if you notice carefully, it is a combination, i.e., (n + k – 1)C(k – 1)

Arrangement Problems Read More »

Probability of Green Balls

There are four balls in a bowl – one red, one blue and two green. If one randomly takes out two balls and claims that at least one ball is green, what is the probability that both balls are green? We will use Bayes’ rule here but first, the prior probabilities.

The total number of pairs from four balls is 4C2 = 6. The prior chance of drawing two greens is 1 in 6, green with red is 2 in 6, and green with blue is also 2 in 6.

Let P(GG|1G) be the required probability of green-green, given at least one green,

\\ P(GG|1G) = \frac{P(1G|GG)*P(GG)}{P(1G|GG)*P(GG) + P(1G|GR)*P(GR) + P(1G|GB)*P(GB)} \\ = \frac{1*\frac{1}{6}}{1*\frac{1}{6} + 1*\frac{2}{6} + 1*\frac{2}{6} } = \frac{\frac{1}{6}}{\frac{5}{6}} = \frac{1}{5}

Probability of Green Balls Read More »

Average of Percentages

A company tested two vaccines (V1 and V2) at two locations (L1 and L2) and got the following success rates.

L1L2
V180%70%
V275%60%

Which one is a better vaccine? V1, without a doubt, eh? Because V1 beats V2 at L1 as well as at L2. At an average of 75% for V1 vs 67.5% for V2. Unfortunately, we cannot conclude which is better until we know the sample sizes. Now, the sample sizes

L1L2
V1100900
V2900100

Leading to total success

L1L2Total
V180630710
V267560735

Leading to a success rate of 71% for V1 and 73.5% for V2. It is sometimes called Simpson’s paradox but is not a paradox. It is just a mistake for not paying attention to the format – percentage – of the result!

Average of Percentages Read More »

Possibilities in the Champions League – Four Teams

We have seen how three English teams could avoid playing each other in the Champions League quarter-finals. What about if four teams reach; this happened on three occasions – 2008, 2009 and 2019 – in the last four decades. It’s impossible to avoid one another. Or is it? Let’s calculate.

Let’s use the same code we used earlier by adding another team, E4.

team <- c("E1", "E2", "E3", "E4", "R5", "R6", "R7", "R8")

itr <- 1000000

draw <- replicate(itr, {

      dr <- sample(team, 8, replace = FALSE)  

     dr1 <- paste(dr[1], dr[2])
     dr2 <- paste(dr[3], dr[4])
     dr3 <- paste(dr[5], dr[6])
     dr4 <- paste(dr[7], dr[8])

     dr_all <- c(str_count(dr1, "E"), str_count(dr2, "E"), str_count(dr3, "E"), str_count(dr4, "E")) 


     if(any(dr_all == 2)){
         counter <- 1
     }else{
        counter <- 0
     }


})

P_avoid <- 1 - mean(draw)
P_avoid

There is a 22.8% chance to avoid – not so bad!

We use the same approach for the analytical solution. The number of ways to form four pairs from eight teams is 8C2 x 6C2 x 4C2 /4! = 105. To avoid the team from the same league, the four English clubs must pair with the other four. The first team has 4, the second team has 3, the third has 2, and the last has one choice. So total = 4 x 3 x 2 = 24. The probability to avoid = 24/105 = 0.228 or 22.8%.

Possibilities in the Champions League – Four Teams Read More »

Possibilities in the Champions League

Three teams from the English premier league have reached the last season’s (2021-22) champions league last eight. But strangely, they avoided each other in the knockouts. The draw for the quarter-final is determined by picking names, at random, in a bowl containing all eight. The first plays with the second, third with the fourth etc. So, how likely are the three EPL teams to avoid each other in the lot?

The simplest way is to run the lot a million times and estimate the average time it happened. Let’s do that in R.

team <- c("E1", "E2", "E3", "R4", "R5", "R6", "R7", "R8")

itr <- 1000000

draw <- replicate(itr, {

      dr <- sample(team, 8, replace = FALSE)  

     dr1 <- paste(dr[1], dr[2])
     dr2 <- paste(dr[3], dr[4])
     dr3 <- paste(dr[5], dr[6])
     dr4 <- paste(dr[7], dr[8])

     dr_all <- c(str_count(dr1, "E"), str_count(dr2, "E"), str_count(dr3, "E"), str_count(dr4, "E")) 


     if(any(dr_all == 2)){
         counter <- 1
     }else{
        counter <- 0
     }


})

P_avoid <- 1 - mean(draw)
P_avoid

The answer turned out to be around 57%.

The next step is to solve this problem analytically. The number of ways to form the first pair is estimated using combinations formula 8C2. For the second group, it is 6C2, the third is 4C2, and the last is 2C2 or 1. This gives a total number = 8C2.x 6C2 x 4C2, of which 4! are the same, as the order of arrangement doesn’t matter. So, after correcting, it becomes 8C2.x 6C2 x 4C2 / 4! = 105

choose(8,2)* choose(6 ,2)*choose(4,2)/ factorial(4)

Now, calculate the number of ways the three English can pair with the other five. For the first team, it’s 5 ways; for the second team, it’s 4; for the third, it’s 3. So total = 5 x 4 x 3 = 60. The probability to avoid = 60/105 = 0.57 or 57%.

Possibilities in the Champions League Read More »

Smoking and Cancer

You tell me smoking causes lung cancer. I know several of my friends who smokes but never got cancer. How do you explain?

Suppose 90% of lung cancer patients are smokers and 20% of people with no lung cancer also smoke. What is the chance that a smoker has cancer? To estimate the answer, we should first know the probability of lung cancer in society. Suppose it is 0.1%.

\\ P(LC|S) = \frac{P(S|LC)*P(LC)}{P(S|LC)*P(LC) + P(S|nLC)*P(nLC)} \\ \\  \frac{0.9*0.001}{0.9*0.001 + 0.2*0.999} = 0.004484305

So, the probability of a random smoker having cancer is 0.44%. So what about non-smokers having lung cancer?

\\ P(LC|nS) = \frac{P(nS|LC)*P(LC)}{P(nS|LC)*P(LC) + P(nS|nLC)*P(nLC)} \\ \\  \frac{0.1*0.001}{0.1*0.001 + 0.8*0.999} =  0.0001251095

It is 0.013%. Therefore, a smoker is 0.44/0.013 = 35 times more likely to get cancer.

Smoking and Cancer Read More »

Probability of Cheat Coin

Anne has a bag with ten coins; one of them is a cheat coin (both side-heads). She picks up one coin and tosses it two times, and both are heads. What is the probability that she picked the cheat coin?

We all know that the probability of drawing the cheat coin from the bag is 1/10, but that was not the question here. It is on chance, given a piece of information is already available. So the ask must be an updated (Bayesian) guess. We can solve the problem in two ways.

Method 1: In one step

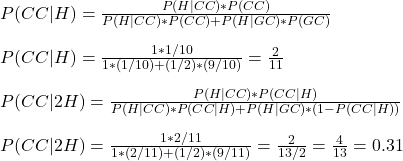
\\ P(CC|2H) = \frac{P(2H|CC)*P(CC)}{P(2H|CC)*P(CC) + P(2H|GC)*P(GC)} \\ \\ P(CC|2H) = \frac{1 * 1/10}{1 *(1/10) + (1/4)*(9/10)} = \frac{4}{13} = 0.31

Method 2: Posterior as the new prior

\\ P(CC|H) = \frac{P(H|CC)*P(CC)}{P(H|CC)*P(CC) + P(H|GC)*P(GC)} \\ \\ P(CC|H) = \frac{1 * 1/10}{1 *(1/10) + (1/2)*(9/10)} = \frac{2}{11}  \\ \\ P(CC|2H) = \frac{P(H|CC)*P(CC|H)}{P(H|CC)*P(CC|H) + P(H|GC)*(1-P(CC|H))} \\ \\ P(CC|2H) = \frac{1 * 2/11}{1 *(2/11) + (1/2)*(9/11)} = \frac{2}{13/2} = \frac{4}{13} = 0.31

The notations are:
P(CC|2H) = chance that it is a cheat coin, given two times heads
P(2H|CC) = chance of two heads for a cheat coin
P(CC) = the prior chance for a cheat coin
P(2H|GC) = chance of two heads for a good coin
P(GC) = the prior chance for a good coin= 1 – P(CC)
P(CC|H) = chance that it is a cheat coin, given heads in the first toss
P(H|CC) = chance of heads for a cheat coin
P(H|GC) = chance of heads for a good coin

Probability of Cheat Coin Read More »

Ultra-processed food and Ovarian Cancer

According to a recent study, the consumption of ultra-processed food (UPF) is linked to a group of cancers, notably ovarian. But what is ultra-processed food? As per a Harvard health blog, corn chips, apple pie, french fries, carrot cake, and cookies are all examples of UPF. And how profound is the impact? In other words, how big is a 20% increase, as the study claims, in the case of ovarian cancer?

Ovarian cancer

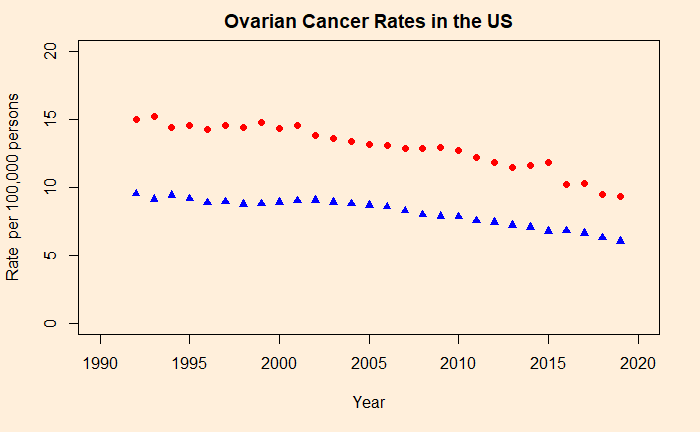
The global incidence of yearly fresh cases of ovarian cancer is 6.6 per 100,000 people in 2020. In the US, it’s 19,880 in 2023, which is about 10 per 100,000 women (age-adjusted).

The red circles are incident rates of new cases, and the blue triangles are deaths. Interestingly, the graph shows a steady decline over the years.

Ultra-processed food and Ovarian Cancer Read More »