November 2021

What to Expect from Tossing of Coins

Guess Which outcome is more likely if I flip a coin six times – HHHHHH or HTTHTH?

Now, a slightly different one: assume a gambler gets 1 dollar for every head and loses 1 for the tail on a coin-tossing game; which of the two outcomes can shock you at the end of the sixth round of play – 6 dollars or 0 dollars?

These two problems have few things in common other than the fact that both are coin games. Let’s understand them quantitatively.

One Prize or Multiple Prizes?

The first problem is getting a specific sequence, i.e. HHHHHH or HTTHTH. The probability of getting any of the two is the same, which is (1/2) multiplied six times (0.5 x 0.5 x 0.5 x 0.5 x 0.5 = 0.0156). In other words, both outcomes have the same chance of about 1%!

In the second problem, the sequence doesn’t matter, but getting (in some order) six heads or three. The second problem needs a new technique called a Bernoulli or binomial trial. In the mathematical form,

the probability of s successes in n rounds is
nCs x ps x q(n-s)

  • nCs, The number of combinations of n things, taken s at a time or [n!/s!(n-s)!]
  • p = probability of success in an individual trial
  • q = probability of failure in an individual trial (= 1 – p)

That “!” mark in the formula means factorial. For example, 4! (four factorial) means 4 x3 x 2 x1; 5! = 5 x 4 x 3 x 2 x 1 etc

Binomial Distribution

Chance for 3 heads out of 6 (which means 0 dollars in the end!)
6C3 x (1/2)3 x (1/2)(6-3) = (6 x 5 x 4 x 3 x 2 x 1)/(3 x 2 x 1 x 3 x 2 x1) x 0.0156 = 0.3125
31% chance of losing all money

Chance for 6 heads out of 6 (6 dollars in the end!)
6C6 x (1/2)6 x (1/2)(6-6) = (6 x 5 x 3 x 2 x 1)/(6 x 5 x 3 x 2 x 1) x 0.0156 = 0.0156.
1% chance of winning all.

Note that the binomial coefficient, 6C3 or 6C6, made the difference between the first problem and the second.

Binomial Probability Calculator

Factorial Calculator

What to Expect from Tossing of Coins Read More »
Three Laws and a Birthday

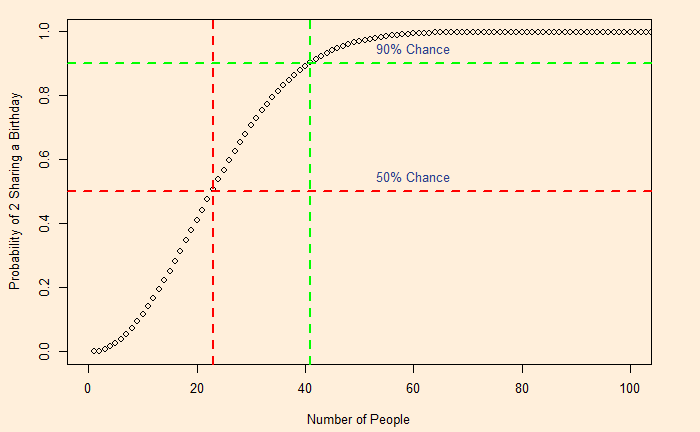
The birthday problem. What is the minimum number of people required to be in a room to have a 90% chance that at least two individuals share a birthday? The answer is about 41 people. You may have guessed more than 41; the puzzle has led to people overestimating the number.

We will see the calculations but a few basic probability concepts first.

Two definitions

Independent Events. Two events are independent if one does not affect the other. Two flips of a coin: the outcome from the second is independent of the first outcome.

Mutually Exclusive Events. When one happens, the other can not occur. Examples are day and night, winning and losing a game, or turning left and right in one.

1. The law of multiplication (AND Rule)

For independent events, the joint probability of occurrence of one and the second is obtained by multiplying their individual probabilities.

P (A and B) = P(A) x P(B)

Flip a coin twice: the chance of getting two heads in succession is equal to the chance of getting the first head x chance of getting the second head. The probability of each is 1 in 2. So the overall probability P (head and head) = (1/2) x (1/2) = 0.25 (25% chance).

euro, euro coin, coin-5132624.jpg

Note that this AND rule is a special case of a general Conjunction Rule that says

P(A and B) = P(A) x P(B given A)

[if A and B are independent, P(B given A) = P(B)]

An example: the probability of drawing two Aces from a deck of cards (no replacement). It is given by multiplying the probability of getting the first ace (4/52), and the second given the first is an ace (3/51) = 12/(52 x 51) = 1/221.

2. The Law of addition (OR Rule)

The probability of getting A or B is equal to the probability of getting A plus the probability of getting B minus the probability of A and B.
P (A or B) = P(A) + P(B) – P (A and B)

The equation simplifies when the events are mutually exclusive, or P (A and B) = 0 (both can not happen at once)

P (A or B) = P(A) + P(B).
I throw a 6-sided dice, and the chance of getting 1 or 3 is = (1/6)+(1/6) = 2/6.

dice, games, play-1294902.jpg

3. The law of subtraction

The probability of something to occur is equal to 1 minus the probability that it does not occur.
P(A) = 1 – P(A’)

The Birthday Problem

Let’s build the solution from the smallest group. What is the probability of two people sharing a birthday in a group of 2? To answer this, we first go to the inverse problem – the chances of two people not sharing a birthday – and subtract that from 1 (using the subtraction rule because you can not have unique and shared birthdays at once).

  1. The chance of one person having a unique birthday = 1
  2. The chances that the second person does not share the previous birthday = 364 available days in 365 = (364/365)

Using the AND rule, we calculate the probability of the two having unique birthdays. It is because the second person’s birthday is not affected by the birth of the first person (independent events).

So, it is 1 x (364/365).

If we extend this logic for a group of 3, the probability becomes 1 x (364/365) x (363/365). So, for 20 people, it becomes
1 x (364/365) x (363/365) x … x (346/365) = 0.58.
Therefore, the chance of at least one shared birthday in a group of 20 is equal to (1 – nobody shares) = (1 – 0.58) = 0.42 (42%)

For a group of 41, it is [1 – 1 x (364/365) x (363/365) x … x (325/365)] = [1 – 0.10] = 0.90 (90%)
So the minimum number of people for a 90% chance to share a birthday is 41

Three Laws and a Birthday Read More »

In Praise of the Boxplot

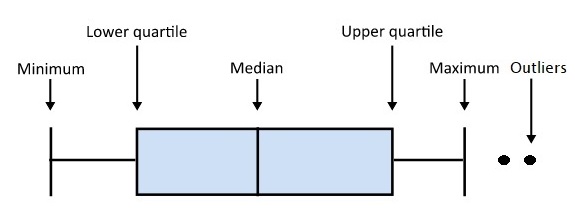
The boxplot is my favourite plot. The plot can summarise and maintain the statistical perspective by showing the data distribution. So, what is a boxplot? The following picture explains it.

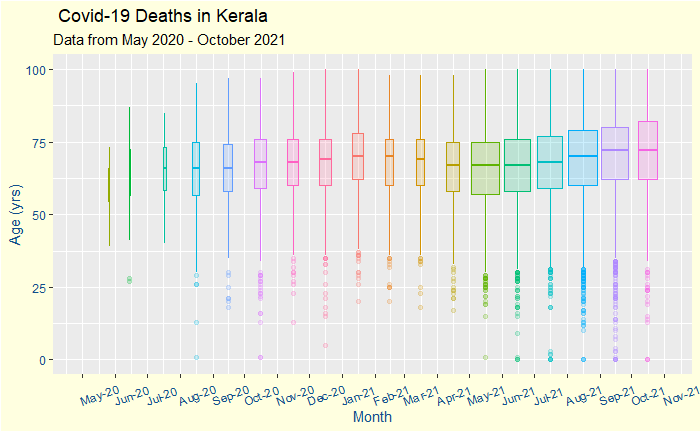
Now, let’s apply the plot to COVID-19 deaths. The data summarises the distribution of COVID deaths from its beginning. Data comes from the Covid dashboard of the Government of Kerala.

First, it is a time series organised monthly. The box’s width represents the total number of deaths in that month. The ‘boxes’ take you through the time of the first wave and the second one caused by the Delta (B.1.617.2) variant.

Broad Observations

The number of deaths shot up from May 2021, the start of the fast-spreading second wave of infection.

The median age of the deceased did not show any reduction after May 2021 (after the arrival of the delta), dismissing speculations on the deadliness of the new strain.

The median age of death marginally dropped starting in March, which coincided with the vaccination program for the elderly. The number systematically increased after June, coinciding with the younger population taking the vaccination. Note that these are correlations and do not necessarily mean causations!

Deaths for people below the age of 35 years do happen but are rare outliers in the statistics.

The incidence of death may be beginning to ease out towards the end.

If you like the boxplot, here is your bonus plot

The new plot includes the actual data points. More men have died from the disease, and for whatever reason, their median age at death is also a couple of years lower than women.

GoK Dashboard

In Praise of the Boxplot Read More »

Monty Hall: You Got Goat

The Monty Hall problem has confused the heck out of people. It is a probability puzzle loosely based on an American game show, Let’s Make a Deal, once hosted by Monty Hall. The problem statement is as follows:

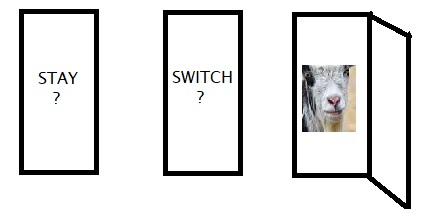
You are in a game show, and the host shows three closed doors behind which there are three objects – one car and two goats. Your task is to guess the correct door and win the car. Once you make the pick, the host opens one of the other two doors and shows you a goat. She now hands in a chance to switch your original choice. Will you stick with your original door or switch to the remaining unopened door?

The correct answer is: you better switch the door, but let’s work out how I arrived at this.

Method 1: Bayes’ Theorem

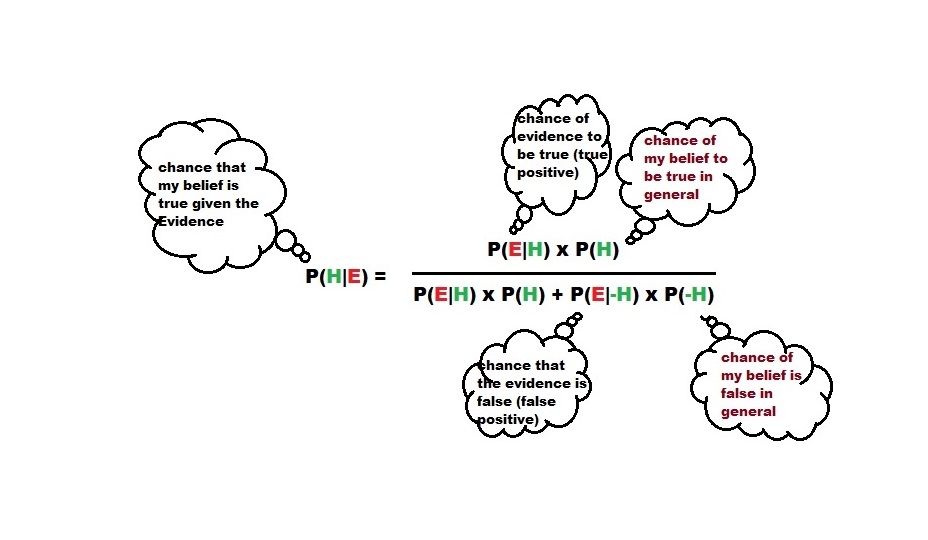
The equation of life! The equation is pasted below:

Turn that to fit our problem, the chance that my door is correct, provided the host showed me the goat, P(MyDoor|ShowGoat) =

P(ShowGoat|MyDoor) x P(MyDoor) / [ P(ShowGoat|MyDoor) x P(MyDoor) + P(ShowGoat|OtherDoor) x P(OtherDoor)]

P(ShowGoat|MyDoor) = chance of the host showing a goat in that door if my choice is right = 0.5 (or 50% chance to pick one of the remaining doors as both have goats)

P(MyDoor) = prior chance of my door having a car = 0.33 (or 1 in 3, at the beginning of the game, it’s anyone’s pick)

P(ShowGoat|OtherDoor) = 1, (100%, the host has only this option as the other door has the car)

P(OtherDoor) = 0.33 (original chance of the other door having a car)

P(ShowGoat|MyDoor) = (0.5 x 0.33) / [ (0.5 x 0.33) + (1 x 0.33)] = 0.33 (1 in 3 chance)

Now, evaluate the chances that the other door has the car once the host showed me a ‘goat door’. P(OtherDoor|ShowGoat) =

P(ShowGoat|OtherDoor) x P(OtherDoor) / [ P(ShowGoat|OtherDoor) x P(OtherDoor) + P(ShowGoat|MyDoor) x P(MyDoor)]

P(ShowGoat|OtherDoor) = chance of the host showing goat in that room if the other room has a car = 1 (or 100%, she has no other option)

P(OtherDoor) = prior chance of the other room having a car = 0.33 (or 1 in 3 at the beginning of the game)

P(ShowGoat|MyDoor) = 0.5. If my door has the car, the host had a 50% chance of opening that door

P(MyDoor) = 0.33 (my original chance of choosing one door)

P(OtherDoor|ShowGoat) = (1 x 0.33) / [ (1 x 0.33) + (0.5 x 0.33)] = 0.667 (2 in 3 chances)

So, switching doors has double the chance of winning than sticking to the original choice.

Method 2: Argument

In the beginning, you have a 1 in 3 chance of picking a door that has the car. That automatically means a 2 in 3 (67%) chance to find the car outside your door. Initially, that 67% was hiding behind two doors, but the host has helped you narrow that chance by removing one. It’s so simple!

Method 3: Perform Experiments

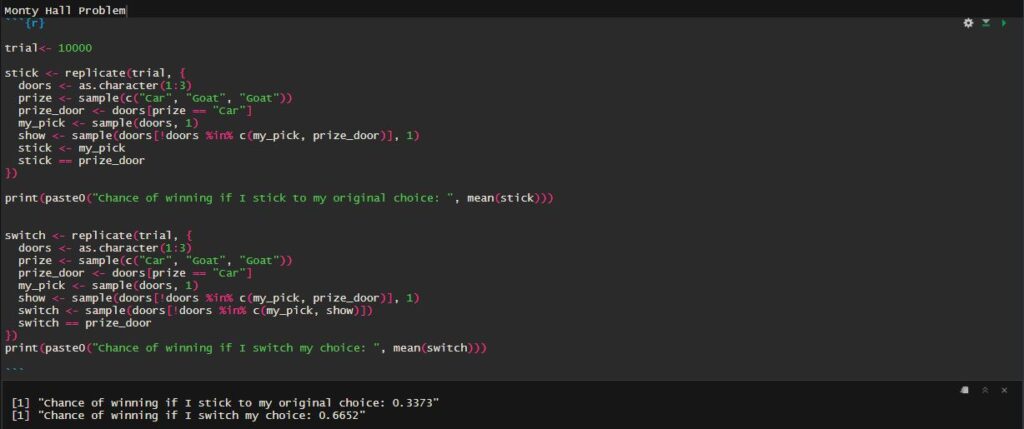
Still not convinced? Then, you do the actual experiment. There are two ways to experiment: 1) Build three doors, perform hundreds of trials with a partner, and find the average. 2) Perform a Monte Carlo simulation and run the trial a few thousand times. Trust me, I have done the latter using R programming, and the code is here:

Monty Hall: You Got Goat Read More »

Carbon Inequality

In an ideal world, our activities should result in about 2 tonnes of CO2 emissions per person per year, but in reality, it is 70 tonnes for the top 1% and less than 1 for the bottom 50%

The new Oxfam report starkly reminds us of the global disparity in consumption-based CO2 emissions and how the Paris Effect may impact the low-income 50%. The report presents a collection of data and future realisations, but I will not go through all of them.

In one of my previous posts, I commented about the present total CO2 emissions, around 47 billion tonnes in 2018 (Gt/yr). Oxfam report estimates the consumption-based emission to be about 35 Gt in 2015. The emission rate we need to target for 2030 is 18 GtCO2 to stay on course with the 1.5 oC target. Before we jump into the report details, take a stop for a quick recap of climate targets. 

The global mean temperature has now reached about 1 oC above the pre-industrial level; the world needs to keep its peak to about 1.5 oC to manage catastrophic climate change. In other words, the world can only emit a total of 420 – 580 Gt, as per the IPCC special report (SR 15), which is already three years old! So what remains with us to spend from today is less than 500 billion tonnes (carbon budget). There are different pathways to achieve the goal, and one of them is to cut the emissions by half by 2030 and net-zero emissions by 2050.

Back to the report: today’s total global consumption-based carbon emission is 35 GtCO2 – 17 from the top 10%, 15 from the middle 40% and a mere 3 from the bottom 50%! The per capita emissions are

21 tonnes per person for top 10%

5 tonnes per person for middle 40%

< 1 tonne per person for bottom 50%


Note that the top 10% is already trending at the total target of 2030 (18 GtCO2). The report estimates the expected reduction of the richest and the middle to be about 10%, which is much lower than the 90% and 57% required to reach parity (everyone shares the same per capita emissions).

The Paris Effect and its gaining traction in the developed world can lead to another moral failure of the equity principle. As we have seen in the distribution of COVID-19 vaccines, the morally agnostic twins, capitalism and technology, parented by populism and mistrust, will again fail to support the marginalised. Forcing emission cuts across the board will disproportionately impact the poor and widen the existing wealth and opportunity gaps. There must be additional climate finance, with a fair share from the top emitters, not just countries but also individuals beyond borders, to support the lower and middle-income groups to achieve the climate targets. Innovators, especially from the developing world, should also use this opportunity and focus more on inclusive low-carbon technologies.

IPCC Special Report

Oxfarm Report on Carbon Inequality

Paris Agreement

Carbon Inequality Read More »

The New Study Reveals That

WebMD ran an article in 2008 titled Eating Breakfast May Beat Teen Obesity. The article caused quite a stir in the public domain. The original study, published in Pediatrics, focused on the dietary and weight patterns of 2,216 teenagers over five years (1998-2003) from public schools in Minneapolis-St. Paul, Minnesota. 

Did the study conclude that breakfast is a medicine for teenagers to fight against obesity? At least the title and the opening remarks gave that impression. Before jumping to a conclusion, let us examine the various possibilities.

Cause or a Coincidence?

The first possibility is that it could be a complete coincidence that those who ate breakfast gained less weight. That is an easy remark that one can pass to any such study.

What Other Reasons?

Think about possibilities that can make someone skip breakfast. Maybe she wakes up late and has no time to breakfast before school. This could be because she sleeps long or goes to bed late. What about the eating habits of people who sleep late at night? The late sleepers may pack their meal with more or multiple sets of food.

What about some of them skipping breakfast because they were already obese (for any other reasons) and wished to cut some calories (cause and outcome reversed)?

How important are the study location, socioeconomic background, and education levels? As per the CDC, even in the US, obesity is lower among people with lower and higher income but higher in middle-income groups. What could be the outcome had the research been conducted in India, Australia, The Netherlands, or the Republic of Congo?

Or Just a Correlation?

Would the conclusions have differed if the researchers had examined their lunch, dinner, or snack habits? WebMD leaves some clues.

“A new study shows teenagers who eat breakfast regularly eat a healthier diet and are more physically active throughout their adolescence than those who skip breakfast”.

So it is not just eating breakfast, but a set of other things, or confounding factors, are also important. The first word to notice is regularly, which suggests certain habits. The second one is more physically active, and the third is a healthier diet, which may include more fibre and less fat. We know cutting excessive fat consumption and regular exercise leads to weight loss.

There are many possible explanations to explain this correlation other than a simplistic statement for weight loss. In statistics, these are confounding variables, which happen when a common cause gives out multiple results, leading to the confusion that one of the outcomes is caused by the other.

WebMD Article

Adult Obesity: CDC

The New Study Reveals That Read More »

Gambling on a Roulette Wheel

It is critical to decide on the objective of visiting a casino – for fun or to make money. If it’s for fun, you can stop reading this post, go to a casino, and have fun. If it’s for making money, the rest of the post is for you.

Gambling is a business whose objective is to make money – pay off the cost of operations and make some profit. Therefore, it is structured to keep the overall odds in its favour. Since it doesn’t care about the individuals in the process, gamblers have opportunities to have fun, get some money if lucky, etc.

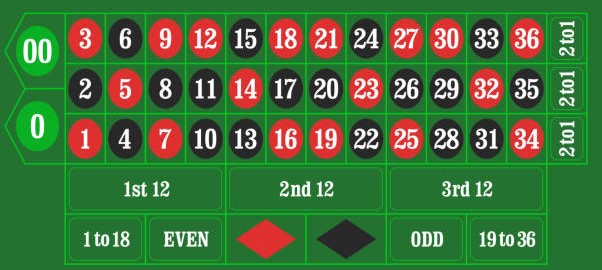
Look at the math and business of the Roulette game:
There are multiple types of bets one can make, and one of them is red-black. You bet 1 dollar on a red; if you get a red, you make a dollar; if black, you lose your money.

Look at the above picture. There are 18 reds in a total of 38 numbers, and your chance to get a red is 18 in 38 (or 18/38). The chance you lose your 1 dollar is 20 in 38 (20/38).

Overall expected profit for you is equal to:
chances of your win x prize you win – chances of your loss x price you lose = (18/38)x(1) – (20/38)x(1) = – 0.0526.

About 5.3 cents per 1 dollar goes to the casino, which is their profit.

Now you change the betting type and say the first 12 for a dozen. In this bet, you will get 2 dollars for every dollar. Your chance of getting in the first 12 is 12/38; for not getting, it is 26/38. If you work out the math, you will get (12/38)x(2) – (26/38)x(1) = – 0.0526.

Take another type that is betting on a single number (straight up). The prize for a win is 35 dollars for every dollar. And the expected returns? (1/38)x(35) – (37/38)x(1). No marks for guessing: 5.3 cents per 1 dollar goes to the casino!

Does that tell you that you will never make money in gambling? You may make money sometimes, and that is where your purpose of visiting makes the difference. If your goal is to make money, you have a problem, as the game is designed for the casino to make money. Or the odds are stacked against you. It is okay if it is for pure fun, as any luck you may get becomes a bonus. It also means that the longer you play, the higher the chance of you losing money as you slowly regress to the mean. The same is true if you place multiple bets simultaneously; it accelerates your chances of reaching the mean, which is biased against you. Since the game never stops, the casino will manage to match their odds in the end.

Gambling on a Roulette Wheel Read More »

SLC24A5 and the Great Human Divide

SLC24A5 is a gene. The gene finds a special place in human cultural discourse because it produces a protein critical to the production of melanin – the great-divider pigment of human skin.

What is an SNIP?

A single nucleotide polymorphism, or SNP, is a variation at a single position in a DNA sequence among individuals. If it occurs in more than 1% of a population, they are an SNP group. If the SNP occurs in a gene (resulting in what is known as alleles), it can have some consequences – rs1426654 is one of them, as we shall see.

A Quick Tour to the Basics

Imagine that the GENOME is a book. There are 23 chapters called CHROMOSOMES. Each chapter contains several thousands of stories, called GENES. Each story is made up of paragraphs, called EXONS, which are interrupted by advertisements called INTRONS. Each paragraph is made up of words called CODONS. Each word is written in letters called BASES. The words are written on long chains of sugar and phosphate called DNA!

– Matt Ridley in “Genome”
gene tree, tree of life, evolution-1490270.jpg

Allele and Us

As we have seen earlier, a gene has more than one allele if an SNP occurs within a gene. Our SLC24A5 gene also has alleles: the original allele that still dominates in the African and East Asian population (and contains the amino acid alanine), and the variant allele dominates in the Europen population (and contains threonine).

Why Me?

Why do ‘the originals’ have an alanine version, and what does it do? To answer the first part of the question, you should know how nature works. It is not that the originals have alanine, but only the alanine-containing humans survived the test of time in that location. The alanine allele triggers pigment production and defends the lower layers of the dermis from cancer-causing ultraviolet light, giving a small but significant additional life expectancy for people carrying this natural sunscreen.

The case with the sun-starved European side is quite the opposite: to fight Vitamin D deficiency, they must capture as much light (UV) as possible, and the pigment melanin is a potentially fatal blocker!

Does This Change Our Attitudes?

Unlikely. The notion that human complexion is only skin deep may be necessary but never a sufficient argument for people to stop distinguishing others based on colour (racism). Irrational as we are, humans will always keep inventing newer tricks to match their fancies and exercise their territorial powers. But this can, at least, refute one such stupid argument, and I will say I did not waste my page!

[1] SNP Definition: Nature

[2] Human Skin Color Gene: Scientific American

[3] SLC24A5: Science

[4] The Light Skin Allele of SLC24A5: Plos

[5] Skin Color for Indian Population: The Hindu

SLC24A5 and the Great Human Divide Read More »

Why Do ‘So Many’ Vaccinated Get Infected?

A news item broke out in October 2021 on the vaccination program in Kerala (India). The journalist on screen was ‘shocked’ at the daily report of 6525 vaccinated and 2802 unvaccinated in the group of 9327 infected adults. Infection numbers among the vaccinated people outnumbered the unvaccinated. And it raised serious doubts over how the state managed the vaccination program.

Let’s try and understand what these numbers mean.

Infection Risks

The number of adults infected in the vaccinated: 6525
The total vaccinated adults in Kerala (at least one dose): 25.01 million
Infection risk for the vaccinated: (6525 / 25,010,000)x100 = 0.026%

The number of infected adults in the unvaccinated: 2802
The number of unvaccinated adults on that date: 1.68 million
Infection risk for the unvaccinated: (2802 / 1,680,000)x100 = 0.167%

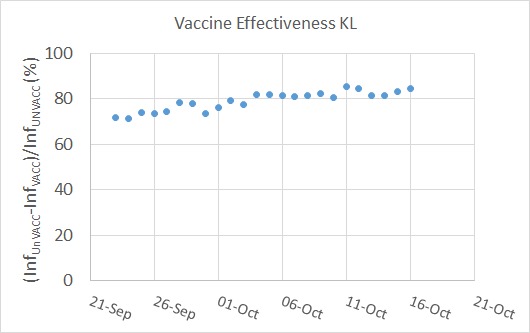
Vaccine effectiveness: (difference in infection risk between unvaccinated and the vaccinated) / infection risk of the unvaccinated = (0.167-0.026)/0.167 = 84%, not bad, heh?

We can repeat the exercise for a month to get a statistical perspective. Here is what I get

I did not use the word efficacy to describe my results, though I used the math behind that calculation. Estimating vaccine efficacies requires a more careful analysis of the infection data, something I leave to the experts in the field. What I did here is a preliminary assessment to make sense of the journalist. And the analysis suggested that the vaccine did what it promised.

Remember our theme?: life is about chances, rationality, and decision-making.

[1] The math of vaccine efficacy; NYT article

[2] Link to Kerala Covid Dashboard

Why Do ‘So Many’ Vaccinated Get Infected? Read More »

Natural Selection

Natural selection does not mean nature selects something. It has no such powers (by the way, what is nature?)! Natural selection is merely the sum of all random activities resulting in an outcome. In other words, nature is what is imposed on it!

The first term is random (/ˈrændəm/; as per OALD: done, chosen, etc., without somebody deciding in advance what will happen or without any regular pattern ). Yes, the processes are random. 

The next up is activities; what are those? They are DNA replication followed by cell division (our life in one sentence). So, how much copying is happening in our bodies? Humans have about 30 trillion cells (30 followed by 12 zeros); on average, each one divides once a day, which is 30 trillion cell divisions per day. Even if you assume a tiny proportion of error during cell division, you could accumulate a few billion (called mutations) daily. 

In simple language, mutations are misspellings of DNA structure while copying. The body corrects most of it, but some may persist. Many of the mutations are neither harmful nor beneficial. So you get away. But, when it happens to the part of DNA that makes up a gene (gene variant), it becomes a serious affair.

Now, let’s come back to natural selection. Some rarer mutations lead to long-lasting consequences (maybe once in a few hundred generations) for an entire species. Say a skin colour change (I will explain that in another blog), a long nose or a pair of wings! 

Let’s take the story of tree frogs. Imagine two treefrogs in a society of treefrogs that got mutations that changed their colour – one got grey and the other green. If they lived in a dark wooded area, the accident enabled the grey variety to camouflage away from predators (snakes and birds). If you return after a few years, you will see the area is full of grey tree frogs. Now, change the scene to a green swamp. The genetic lottery is now with the green variant.  

The actions were random in both cases, but the outcome was specific.

When Charles Darwin (1809-1882) and Alfred Russel Wallace (1823-1913) came up with the term natural selection, little did they know his grandchildren would give it the opposite meaning.

Natural Selection Read More »