A doctor wants to diagnose whether a patient has a fever or is healthy. The patient can explain the conditions in three options: “Normal,” “Cold,” or “Dizzy.” The doctor has statistical data on health and how patients feel. If a patient comes to the doctor and reports “normal” on the first day, “cold” on the second, and “dizzy” on the third, how is the diagnosis done?
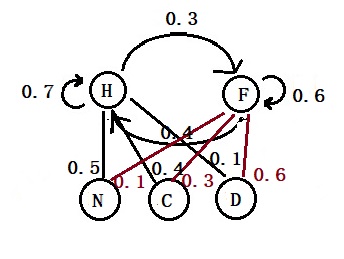
The probability of H today, given it was H the previous day = 0.7
The probability of F today, given it was H the previous day = 0.3
The probability of F today, given it was F the previous day = 0.6
The probability of H today, given it was F the previous day = 0.4
The probability of appearing N, given H, P(N|H) = 0.5
The probability of appearing C, given H, P(C|H) = 0.4
The probability of appearing D, given H, P(D|H) = 0.1
The probability of appearing N, given F, P(N|F) = 0.1
The probability of appearing C, given F, P(C|F) = 0.3
The probability of appearing D, given F, P(D|F) = 0.6
The Viterbi steps are:
1) Estimate prior probabilities of being healthy (H) or fever (F).
2) Calculate the posterior (the numerator) of day 1 using Bayes.
3) Compare the posteriors of the two posteriors (H vs F) and find out the most likely conditions.
4) Use it as the prior for the next day and repeat steps 2 and 3.
Day 1: “Normal”
Step 2: Calculate the posterior (the numerator) of day 1 using Bayes.
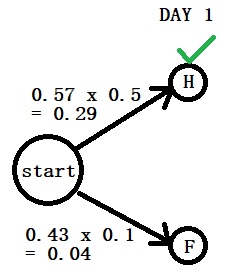
P(H|N) = P(N|H) x P(H) = 0.57 x 0.5
P(F|N) = P(N|F) x P(F) = 0.43 x 0.1
You can see the pattern already. The first comes from the transition probabilities (0.57) and the second from the emission (0.5).
Step 3: Compare the posteriors
P(H|N) > P(F|N)
Day 2: “Cold”
Now, we move to the next. Note that we can’t remove the branch that was lower on the first day as it can contribute to the next day.
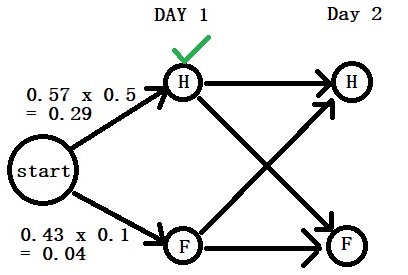
Part 1: We start with Healthy (day 1) – Healthy (day 2) by multiplying the transition probability (0.7) with the emission probability (0.4), and the contribution comes from the earlier step (0.29). 0.7 x 0.4 x 0.29 = 0.08.
That is not the only way to arrive at “Healthy”. It can also come from the “Fever” of the previous day. Do the same math: 0.4 x 0.4 x 0.04 = 0.0064
So, there are two ways to arrive at H on the second day. One has a probability of 0.08 (start – H – H), and the other has 0.0064 ((start – C – H)). The first is greater than the second; retain Start-H-H.
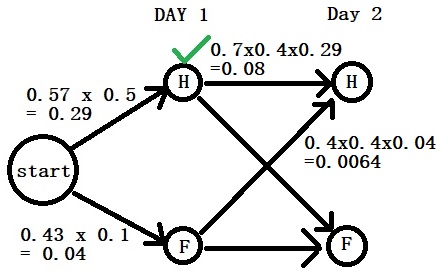
0.08 is the maximum probability we carry now for H to fight against F on day 2.
Part 2: Do the same analysis for the maximum probability for F on day 2.
Two arrows lead to “Fever”. The first gives a probability of 0.6 x 0.3 x 0.04 = 0.0072, and the second, 0.3 x 0.3 x 0.29 = 0.02. Retain 0.02 as the probability for “Fever” as it is higher than 0.0072.
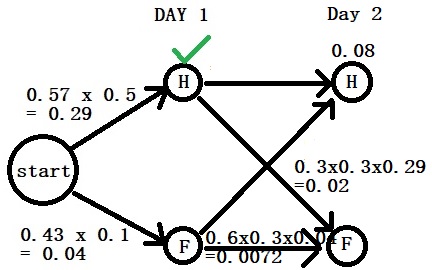
Final Part: Compete H vs F. 0.08 > 0.02. So H is on day 2 as well.
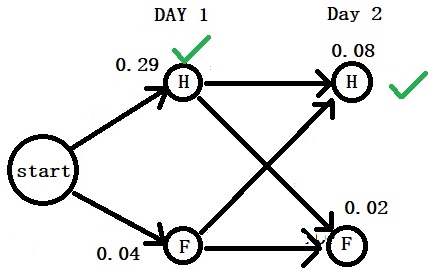
Day 3: “Dizzy”
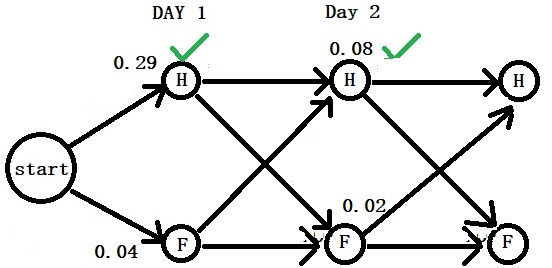
H-H: 0.7 x 0.1 x 0.08 = 0.0056
F-H: 0.4 x 0.1 x 0.02 = 0.0008
F-F: 0.6 x 0.6 x 0.02 = 0.0072
H-F: 0.3 x 0.6 x 0.08 = 0.0144
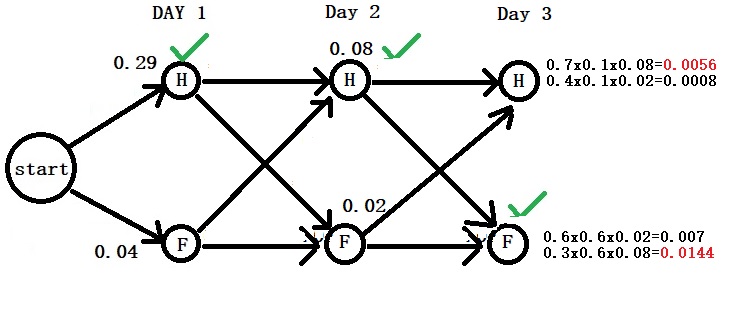
Given the patient’s feedback, the assessment would have resulted in Healthy on days 1 and 2 but Fever on day 3.
References
Viterbi algorithm: Wiki
The Viterbi Algorithm: ritvikmath

