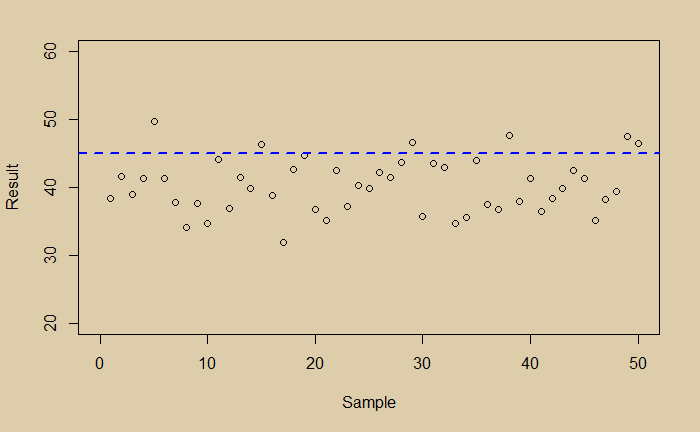
Imagine you did a measurement and collected the following 50 data points.
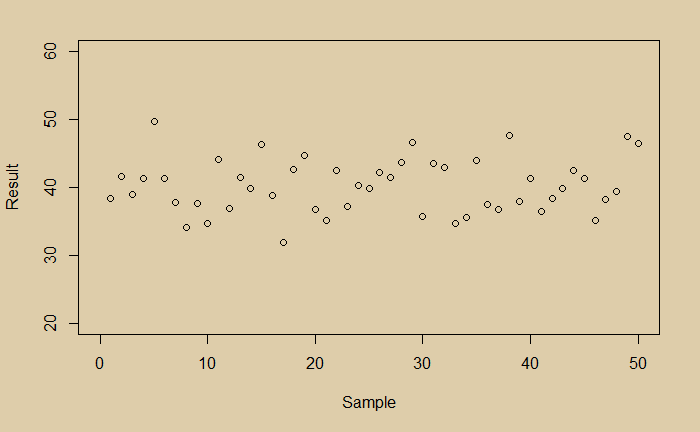
What would you conclude? You see a little noisy data. You do a regression and get the following average line.
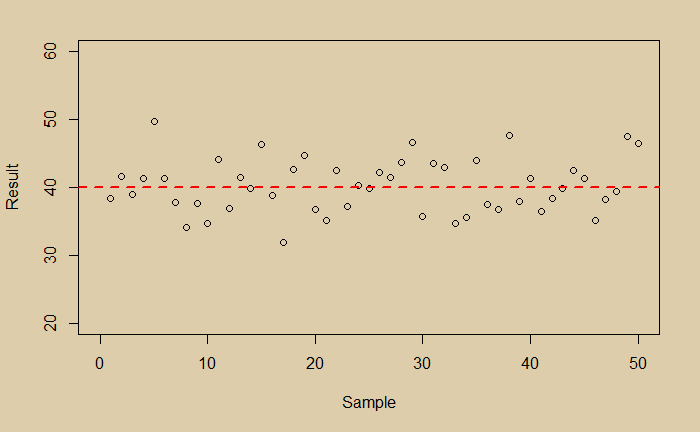
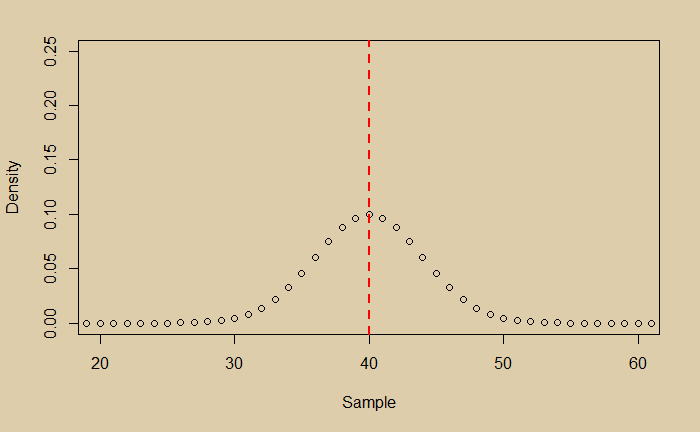
Now you are happy that you managed the random scatter of the data; you got the expected value of the experiment. And it is 40. You then plot the distribution of your data and find it is perfectly normal.
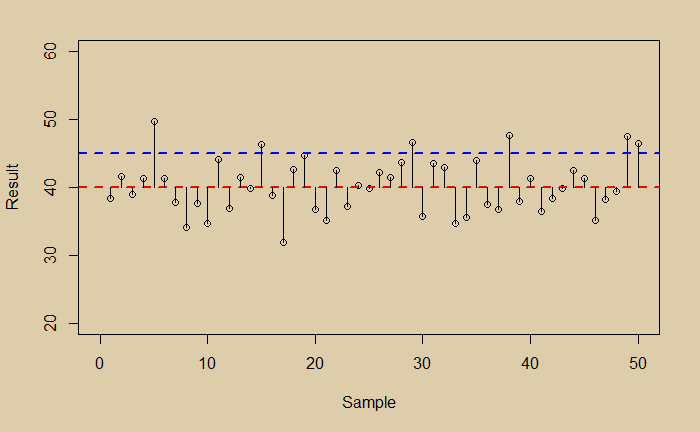
Imagine your true value is 45, and your experiment had a bias.
Suddenly you have two problems, scatter (noise) and bias. Which one is a bigger problem to address?