I have shown you my estimates on vaccine effectiveness in Kerala in an earlier post. The plot is reproduced below.

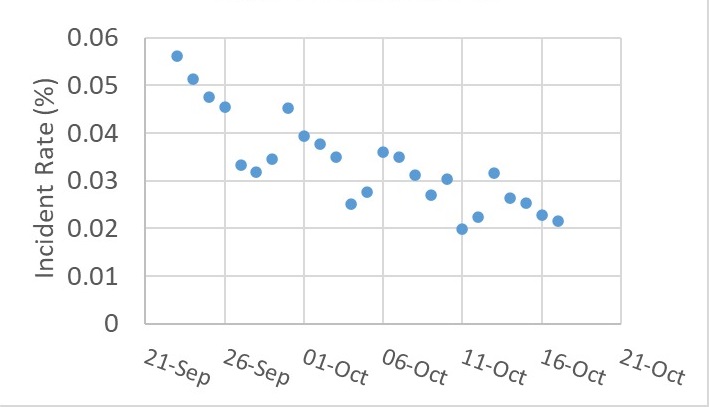
You may have noticed that the effectiveness was steadily going upwards. Intrigued, it has prompted me to check what was going on with the other variables during the same period. One of them was the overall incident rate (shown below).

Puzzled by those periodic minima in the plot? It is an artefact in the data caused by the lower-than-usual number of tests on Sundays!
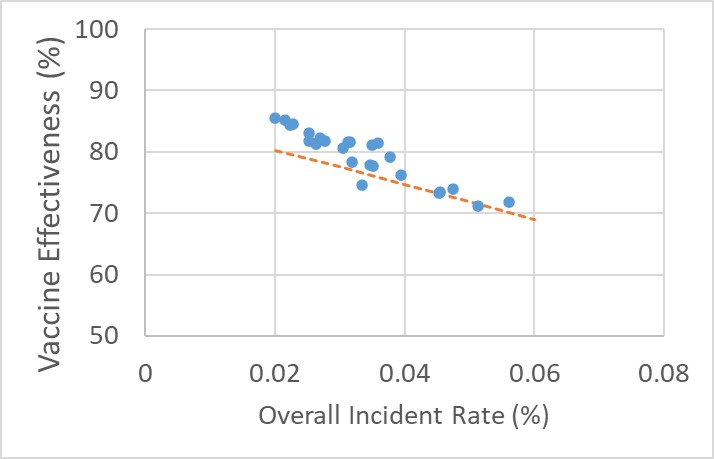
Yes, you guessed it right: the next step is to plot the incident rate with vaccine effectiveness. As expected, it is a straight line!

Correlation or Causation
It was still not easy to know what was happening. The whole observation can be a confounded outcome of something else. We have seen how chance plays its role in containing the disease outbreak (the post of swiss cheese!).
The next logical step is to perform the calculations and check if the trends are making sense. The calculations are:
Let P be the prevalence of the disease (incidence rate multiplied by some number to cover the who can still infect others at a given time). V represents the holes in the vaccination barrier, U is the holes in the unvaccinated (probability = 1), M is the holes in the mask usage, and n is the number of exposures that a person encounters. Here, I’ve stopped at mask as the only external factor, but you can add more barriers such as safe distance.
The chance of getting infected in n encounters with the virus = (1 – chance of being lucky in n encounters)
The chance of getting lucky in n encounters is = nCn x (chance of being lucky once)n x (chance of being unlucky once)0 = (chance of being lucky once)n.
The probability of being lucky once = (1 – chance of getting infected in a single encounter). The chance of getting infected is the joint probability of breaking through multiple barriers. So luck = (1 – P x M x V) for a vaccinated person and (1 – P x M) for an unvaccinated person. Note that V is related to 1 – prior assumed efficacy of the vaccine.
Finally, the effectiveness of vaccine = { [1 – (1 – P M )n] – [1 – (1 – P M V)n] } / {1 – (1 – P M)n}
You can already see from the expression that the vaccine effectiveness is a function of P, the prevalence. Repeat the calculations for a few incidence rates, and the results are plotted along with the actual data. The dotted line represents the estimation.

Key Takeaways
An apple to apple comparison between vaccines requires, among other things, the prevalence of the disease during the period of the efficacy trials. Part of the reason why many of the Covid 19 vaccines are showing modest efficacy levels lies in the extraordinary high incident rate of the illness prevailing through the last year and a half. A high prevalence of disease in society means a person, even though vaccinated, would encounter the virus several times, increasing the probability to get infected. Every such event is an additional test to the efficacy.

