A news item broke out in October 2021 on the vaccination program in Kerala (India). The journalist on screen was ‘shocked’ at the daily report of 6525 vaccinated and 2802 unvaccinated in the group of 9327 infected adults. Infection numbers among the vaccinated people outnumbered the unvaccinated. And it raised serious doubts over how the state managed the vaccination program.
Let’s try and understand what these numbers mean.
Infection Risks
The number of adults infected in the vaccinated: 6525
The total vaccinated adults in Kerala (at least one dose): 25.01 million
Infection risk for the vaccinated: (6525 / 25,010,000)x100 = 0.026%
The number of infected adults in the unvaccinated: 2802
The number of unvaccinated adults on that date: 1.68 million
Infection risk for the unvaccinated: (2802 / 1,680,000)x100 = 0.167%
Vaccine effectiveness: (difference in infection risk between unvaccinated and the vaccinated) / infection risk of the unvaccinated = (0.167-0.026)/0.167 = 84%, not bad, heh?
We can repeat the exercise for a month to get a statistical perspective. Here is what I get
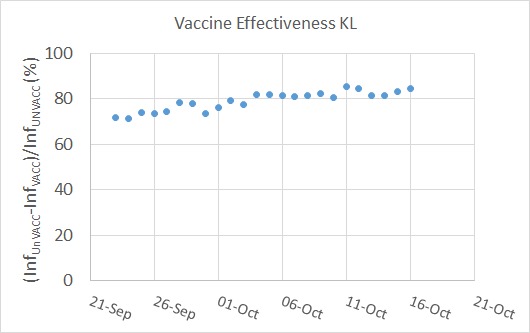
I did not use the word efficacy to describe my results, though I used the math behind that calculation. Estimating vaccine efficacies requires a more careful analysis of the infection data, something I leave to the experts in the field. What I did here is a preliminary assessment to make sense of the journalist. And the analysis suggested that the vaccine did what it promised.
Remember our theme?: life is about chances, rationality, and decision-making.
[1] The math of vaccine efficacy; NYT article
[2] Link to Kerala Covid Dashboard

