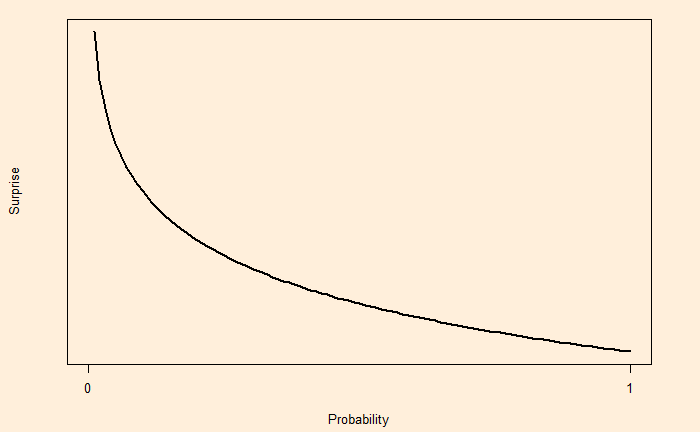
Entropy is a concept in data science that helps in building classification trees. The concept of entropy is often explained as an element of ‘surprise’. Let’s understand why.
Suppose there is a coin that falls on heads nine out of ten or the probability of heads, p(H) = 0.9. So, if one tosses the coin and gets heads, it is less of a surprise as we expect it to show this outcome more often. whereas when it shows a tail, it is more surprising. In other words, surprise is somewhat an inverse of the probability, i.e. S = 1/p. But that has a problem.
If the probability of something is 1 (100% certain), 1/p becomes 1/1 = 1. Since we know the chance of that outcome is 100%, it should not be a surprise at all, but we get 1. To avoid that situation, S is defined as log (1/p).
p = 1; S = log (1/1) = 0.
On the other hand,
p = 0; S = log(1/0) = log(1) – log(0) = undefined.

It is a practice to use log base 2 for calculating surprise for two outputs.
Surprise = log2(1 / Probability)
Now, let’s return to the coin with a 0.9 chance of showing heads. The surprise for getting heads is log2(1/0.9) = 0.15 and log2(1/0.1) = 3.32 for tail. As expected, the surprise of getting the rarer outcome (tails) is larger.
If the coin is flipped 100 times, the expected value of heads = 100 x 0.9 and the expected value of tails = 100 x 0.1.
The total surprise of heads = 100 x 0.9 x 0.15
The total surprise of tails = 100 x 0.1 x 3.32
The total surprise = 100 x 0.9 x 0.15 + 100 x 0.1 x 3.32
The total surprise per flip = (100 x 0.9 x 0.15 + 100 x 0.1 x 3.32)/100 = 0.9 x 0.15 + 0.1 x 3.32 = 0.47
This is entropy – the expected value of the surprise.

