Bergstrom and West, in this book, Calling Bullshit, introduce the “Principle of Proportional Ink”, as a modification of the concept that Edward Tufte developed of data visualisation,
When a shaded region is used to represent a numerical value, the area of that shaded region should be directly proportional to the corresponding value.
Here is a comparison between two entities, A and B, with values 2 and 4, respectively. In the left plot, both width and height are doubled to represent B, which is twice that of A. This magnifies the area of B to four times that of A. On the other hand, the comparison on the right has the size of B double that of A.
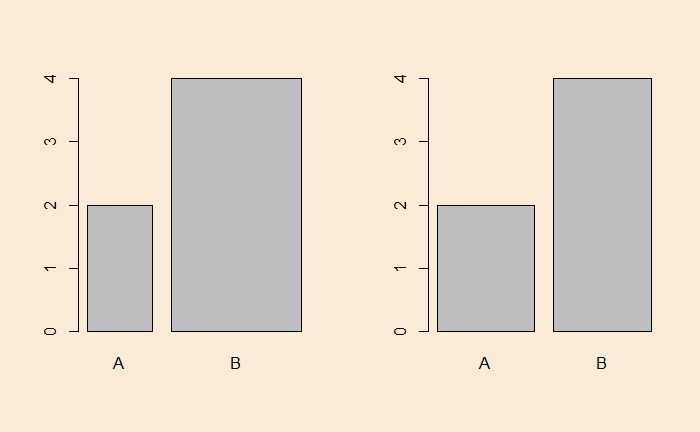
As per the principle of proportional ink, the right plot better represents the relative magnitudes to the reader.

