In the last post, we have seen the power of the hypothesis test for a mean, which is away from the null hypothesis. What happens if the true mean is further away, say 110 instead of 108? Let’s run the following code and you get it.
power_calc <- function(alt){

Null_mu <- 100
sigma <- 16
N_sample <- 16
alpha <- 0.05
Alt_mu <- alt

z <- qnorm(alpha, 0, 1, lower.tail = FALSE)
X_05 <- z * sigma /sqrt(N_sample) + Null_mu
Z_cum <- (X_05 - Alt_mu) / (sigma/sqrt(N_sample))
pnorm(Z_cum, 0, 1, lower.tail = FALSE)

}

power_calc(110)
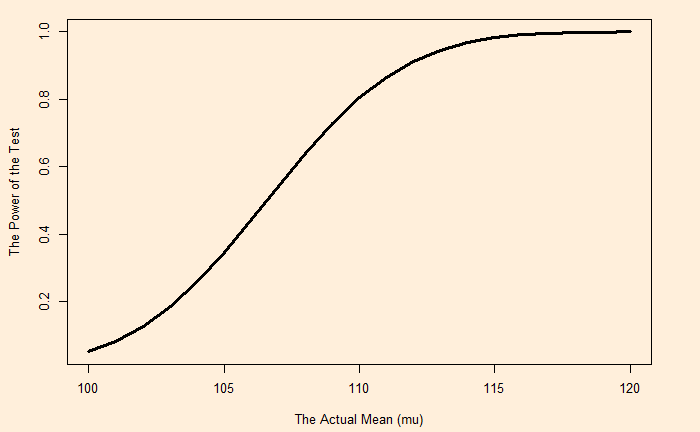
You see, the power is increased from 0.64 to 0.8. The whole spectrum of power values from the null hypothesis mean (100) all the way to 120 is shown below.

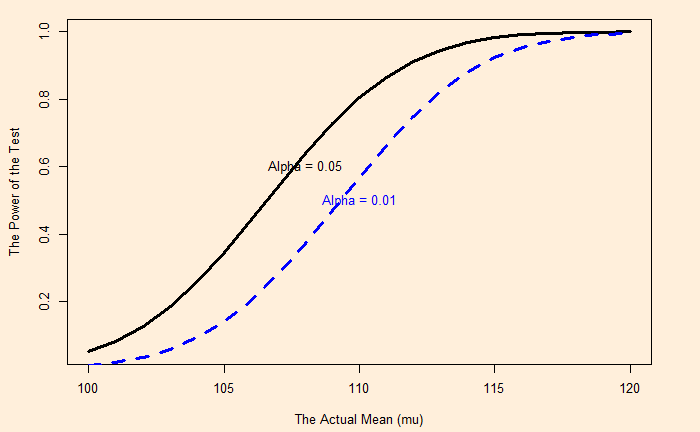
When alpha is reduced, the power is also reduced (type II error increases).

Reference
Power Functions: PennState

