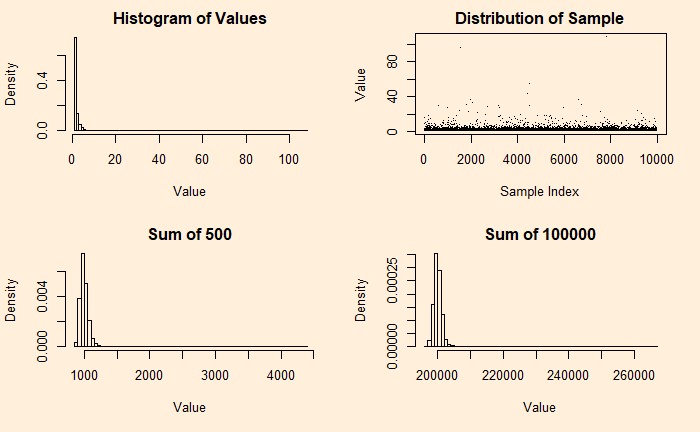
Pareto is an asymmetric distribution; useful in describing practical applications such as uncertainties in business and economics. An example is the 80:20 rule, which suggests that 80% of the outcome (wealth) is caused (controlled) by 20%. It’s a special case of Pareto distribution with a shape factor = 1.16.
Let’s see how they appear for shape factor = 2.

Even after 100,000 additions, the distribution has not become a Gaussian. Recall that a coin with a 95% bias is close to a bell curve after 500 additions.
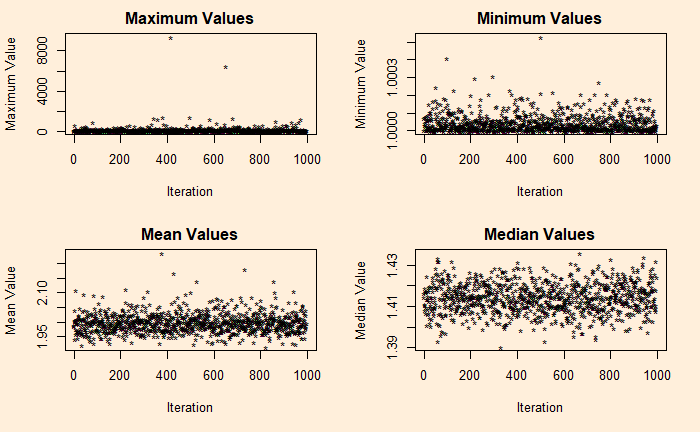
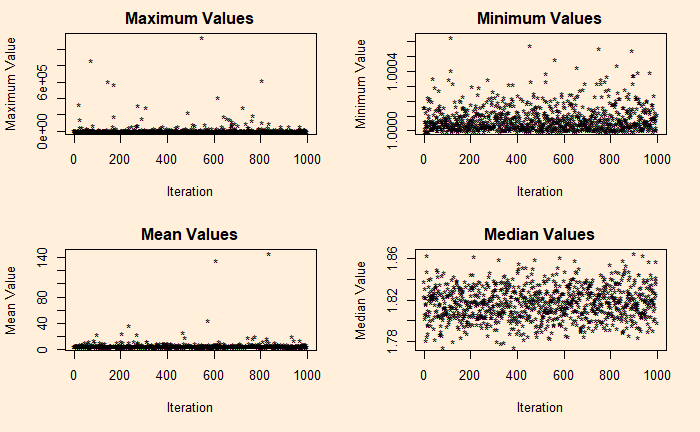
If you want to understand the asymmetry of Pareto, see the following four plots describing the maximum, minimum, mean and median of 10,000 samples collected from the distribution, repeated about 1000 times (Monte Carlo) for the plot.

It’s a total terror for shape factor = 1.16 (the 80:20) – a median of 1.8 and a maximum close to a million!

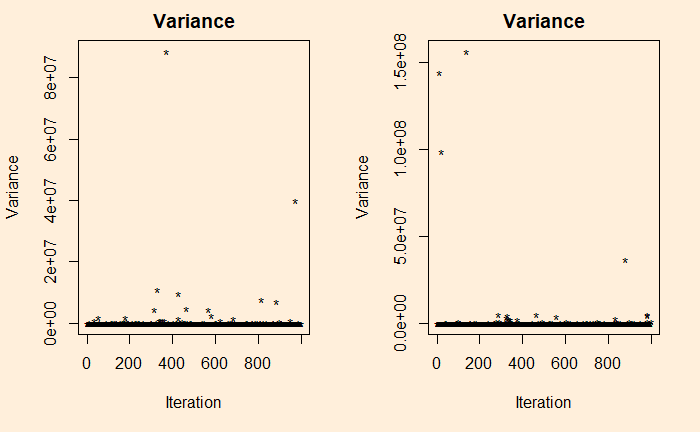
Want to see the variance?

References
Pareto distribution: Wiki
The 80-20 Rule: Investopedia

