The validity of newly explored data from the perspective of the existing population is the foundation of the hypothesis test. The most prominent hypothesis test methods—the Z-test and t-test—use the central limit theorem. The theorem prescribes a normal distribution for key sample statistics, e.g., average, with a spread defined by its standard error. In other words, knowing the population’s mean, standard deviation and the number of observations, one first builds the normal distribution. Here is one example.
The average rainfall in August for a region is 80 mm, with a standard deviation of 25 mm. What is the probability of observing rainfall in excess of 84 mm this August as an average of 100 samples from the region?
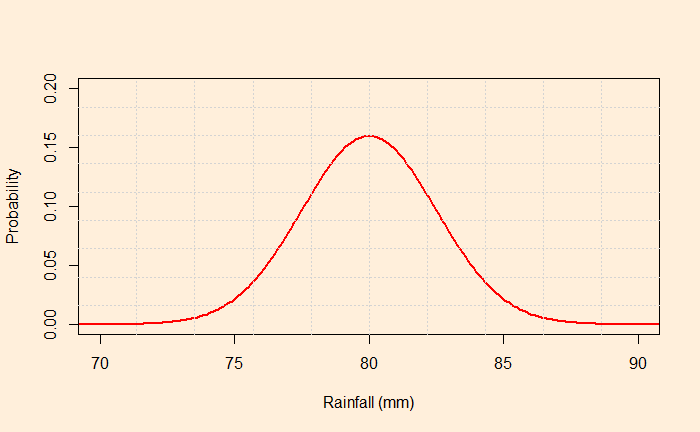
The central limit theorem dictates the distribution to be a normal distribution with mean = 80 and standard deviation = 25/sqrt(100) = 2.5.

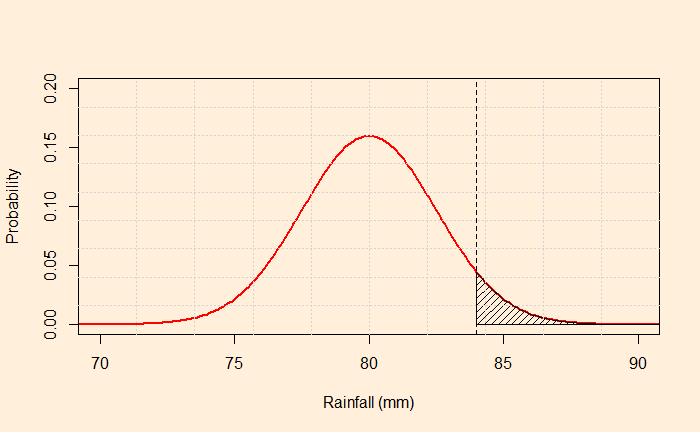
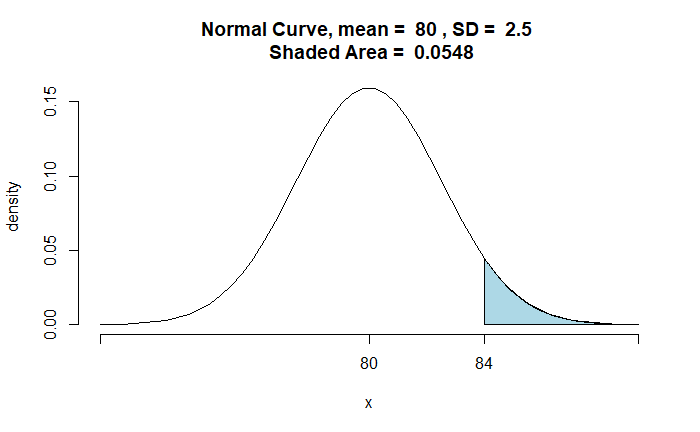
Mark the point corresponds to 84; the required probability is the area under the curve above X = 84 (the shaded region below).

The function, ‘pnormGC’, from the package ‘tigerstats’ can do the job for you in R.
library(tigerstats)
pnormGC(84, region="above", mean=80, sd=2.5,graph=TRUE)
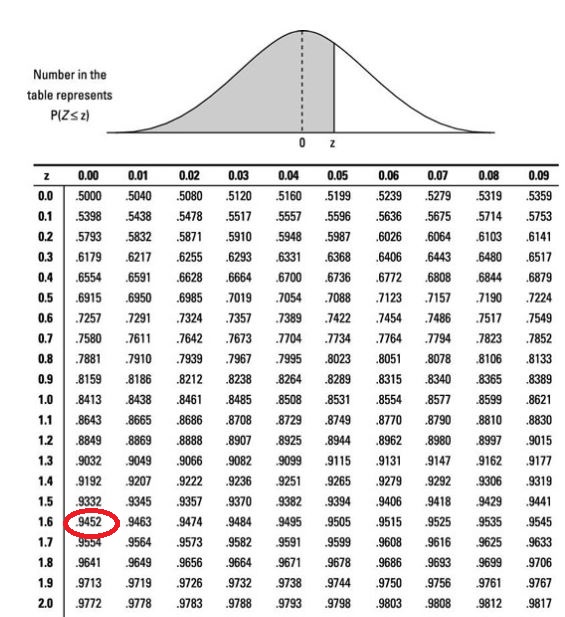
The traditional way is to calculate the Z statistics and determine the probability from the lookup table.
P(Z > [84-80]/2.5) = P(Z > 1.6) 
1 - 0.9452 = 0.0548Well, you can also use the R command instead of searching in the lookup table.
1 - pnorm(1.6)
