We continue from where we stopped last time and develop an R code for survival analysis.
We need to code 1 for people who experienced the event, and the censored ones (who haven’t experienced or left the group) get 0. Note that you can substitute indicator 2 for 1 and 1 for 0. The following are the first ten entries of the data frame.
| group | weeks | Illness |
| Treatment | 6 | 1 |
| Treatment | 6 | 1 |
| Treatment | 6 | 1 |
| Treatment | 6 | 0 |
| Treatment | 7 | 1 |
| Treatment | 9 | 0 |
| Treatment | 10 | 1 |
| Treatment | 10 | 0 |
| Treatment | 11 | 0 |
| Treatment | 13 | 1 |
The survival package
The first thing we want is the ‘survival’ package. After installing the package, type the following commands.
ill_fit <- survfit(Surv(weeks, illness) ~ group, data = ill_data1, type = "kaplan-meier")
summary(ill_fit)

par(bg = "antiquewhite1")
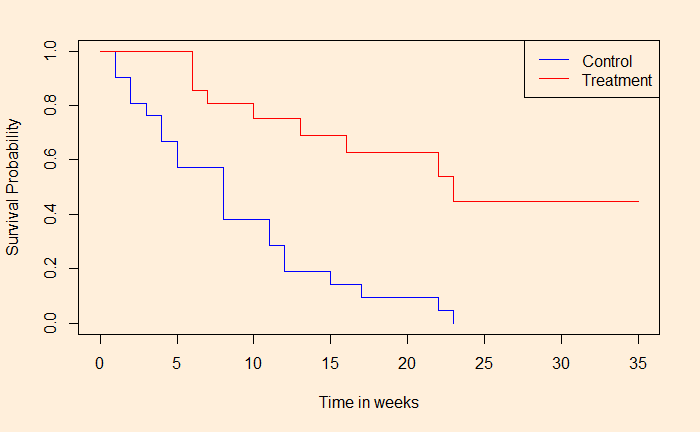
plot(ill_fit, col = c("blue", "red"), xlim = c(0,35), xlab = "Time in weeks", ylab = "Survival Probability")
legend("topright", legend = c("Control", "Drug"), col = c("blue", "red"), lty = c(1,2))
And the output is:
Call: survfit(formula = Surv(weeks, illness) ~ group, data = ill_data1,
    type = "kaplan-meier")

                group=Control
 time n.risk n.event survival std.err lower 95% CI upper 95% CI
    1     21       2   0.9048  0.0641      0.78754        1.000
    2     19       2   0.8095  0.0857      0.65785        0.996
    3     17       1   0.7619  0.0929      0.59988        0.968
    4     16       2   0.6667  0.1029      0.49268        0.902
    5     14       2   0.5714  0.1080      0.39455        0.828
    8     12       4   0.3810  0.1060      0.22085        0.657
   11      8       2   0.2857  0.0986      0.14529        0.562
   12      6       2   0.1905  0.0857      0.07887        0.460
   15      4       1   0.1429  0.0764      0.05011        0.407
   17      3       1   0.0952  0.0641      0.02549        0.356
   22      2       1   0.0476  0.0465      0.00703        0.322
   23      1       1   0.0000     NaN           NA           NA

                group=Treatment
 time n.risk n.event survival std.err lower 95% CI upper 95% CI
    6     21       3    0.857  0.0764        0.720        1.000
    7     17       1    0.807  0.0869        0.653        0.996
   10     15       1    0.753  0.0963        0.586        0.968
   13     12       1    0.690  0.1068        0.510        0.935
   16     11       1    0.627  0.1141        0.439        0.896
   22      7       1    0.538  0.1282        0.337        0.858
   23      6       1    0.448  0.1346        0.249        0.807
We can see the difference in survival chances for people who had undergone treatment vs those who had not. Is this significant, and if so, how much is the difference? We will see next.

