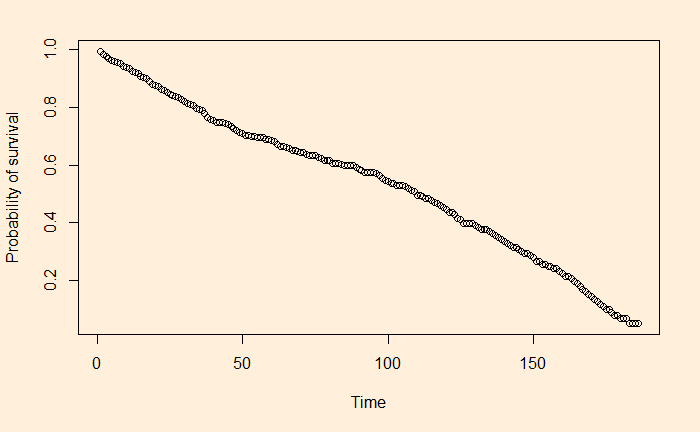
Survival analysis is used in many fields to understand certain events occurring as a function of time. Examples are patients surviving illness after treatments, employee turnover of companies, etc.
Survival plots are representations where the X-axis gives time, and the Y-axis gives the percentage (or proportion) of survivors or the portion that did not experience the event. Kaplan-Meier estimator is typically used to generate survival plots from experimental data.