You know what happens if you roll a fair die; you get one of the six faces. But what happens when you try it 10000 times and plot the frequency or the probability?
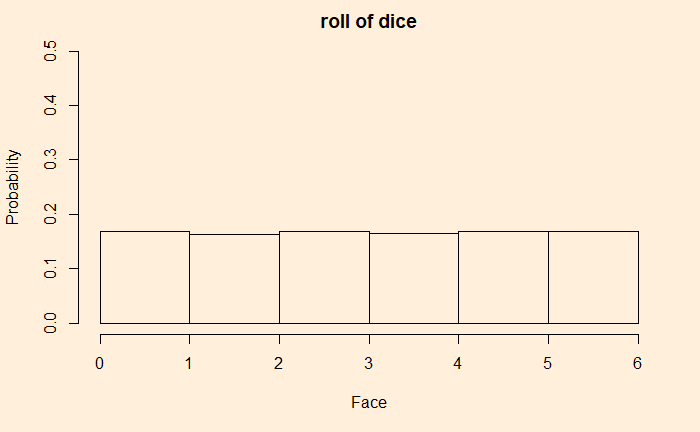
We have a uniform distribution with probability = 1/6. What happens if we throw two dice and plot the distribution of their sums?

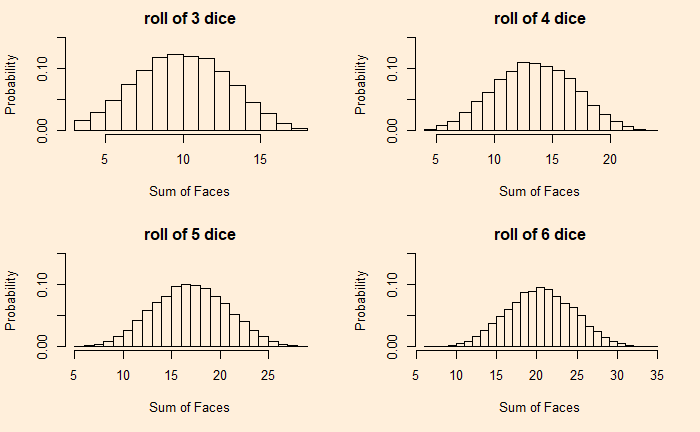
It resembles a triangular distribution with a maximum probability of getting seven as the sum. Let’s not stop here: add the outcomes of four dice.
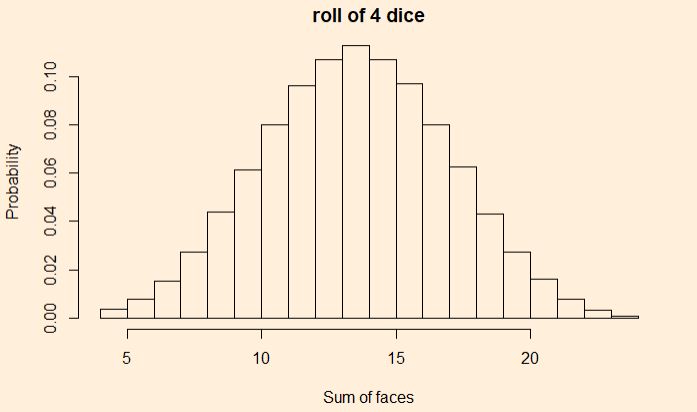
It appears more like a uniform distribution. Let’s insert one such distribution and see how it looks.
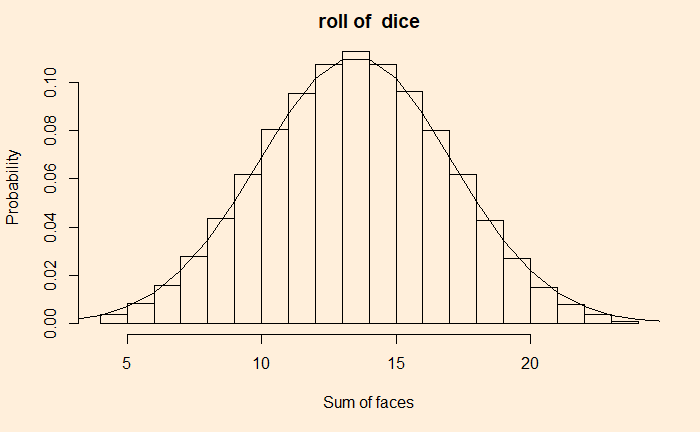
We can see the more the number of such random outcomes we add (more number of dice together), we approach the realm of the central limit theorem.