Solar Photo Voltaic (PV) is the most direct pathway for converting solar energy to use, say, electricity. While sunlight is available everywhere, they don’t fall at the same rate in different parts of the world, in different months of the year. The rates are described as irradiance or the energy that hits a unit area every second (W/m2).
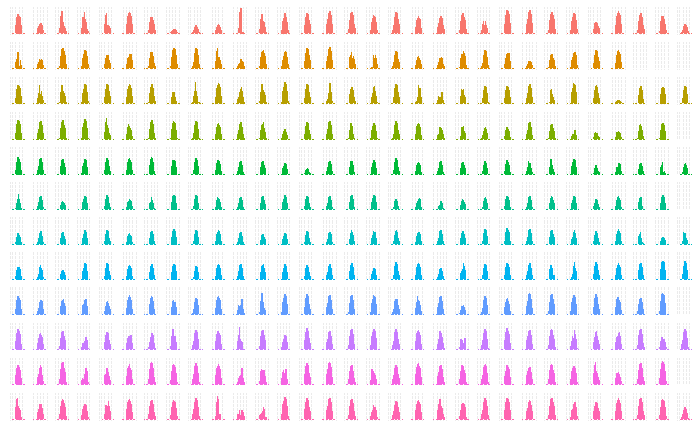
The following plot presents annual sunlight in one such location in Australia – irradiance against the hours of the day.

The plot also demonstrates one of the cool functions of R, factet_grid in ggplot. The code is presented below.
sol_plot <- sol_data %>% ggplot(aes(x = Time, y = Irradiance, colour = factor(Month)))+
  geom_bar(aes(), stat="identity", width=.5) +
  facet_grid(Month~Day) +

theme(strip.background = element_blank(), strip.text = element_blank(), axis.title.x = element_blank(), axis.title.y = element_blank(), axis.ticks.x = element_blank(), axis.text.x = element_blank(), axis.ticks.y = element_blank(), axis.text.y = element_blank())  +
theme(legend.position="none")

sol_plot
The capacity factor is one handy parameter to remember while estimating the solar energy potential of a place. It is the actual amount of energy obtained (in MWh) in an average hour of the year if you install a one MW plant. You can get it by dividing the actual electricity output by the maximum possible output. The number typically varies between 10% – 30%.

