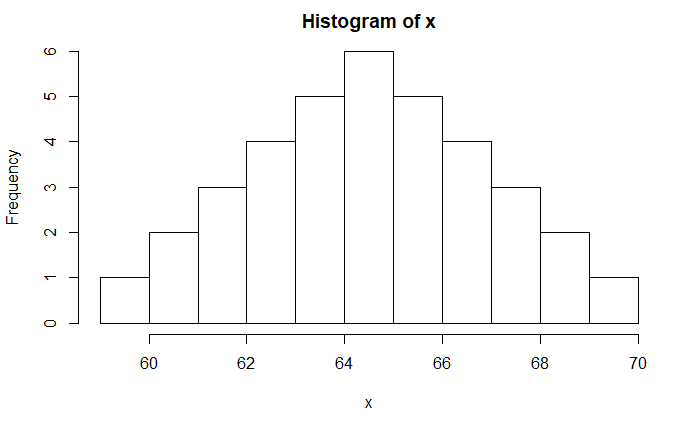
Skewness is the measure of symmetry or the lack of it. A symmetric dataset means data is distributed equally on the left and right of the mean (or median). Following is an example of a symmetric distribution.
Skewness
It is defined as (Pearson’s moment coefficient of skewness)

The skewness of the data is close to zero for symmetric distribution, which is the case with the figure above. A positive value for g1 indicates positive skewness or right-tailed, and a negative g1 is for negative skewness or left-tailed.
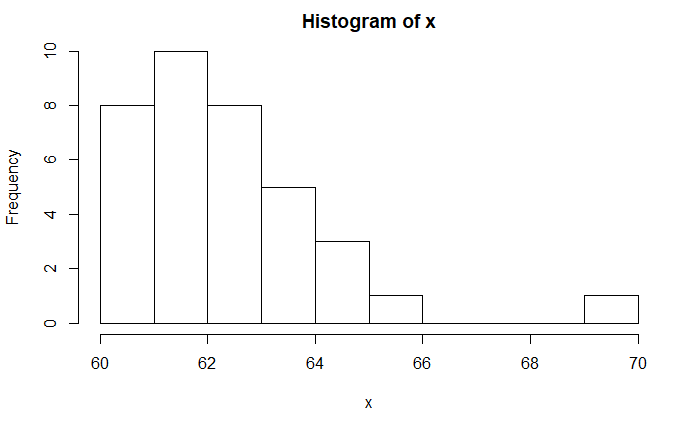
Following is an example of a positively skewed distribution (right-tailed). Its skewness is calculated to be 1.08 using the R function, ‘skewness’ (you must install library ‘moments‘ for that).
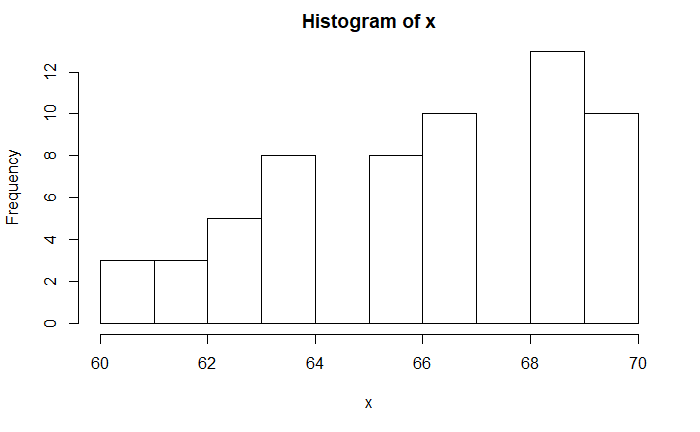
In the same way, the skewness of the following plot is -0.43; it is a negatively skewed distribution (left-tailed).
Kurtosis
Kurtosis is the measure of how heavy or light the tail is.

A kurtosis value of 3 indicates standard normal distribution. Excess Kurtosis (Kurtosis – 3) is a deviation from a standard normal distribution.
Finally, the codes used to generate those distributions and their properties.
library(moments)


x <- c(rep(59.99999, each = 1), rep(61, each = 2), rep(62, each = 3), rep(63, each = 4), rep(64, each = 5), rep(65, each = 6), rep(66, each = 5), rep(67, each = 4), rep(68, each = 3), rep(69, each = 2), rep(70, each = 1))
hist(x, breaks = 10)

skewness(x)
kurtosis(x)

x <- c(rep(60, each = 8), rep(62, each = 10), rep(63, each = 8), rep(64, each = 5), rep(65, each = 3), rep(66, each = 1), rep(70, each = 1))
hist(x, breaks = 10)

skewness(x)
kurtosis(x)

x <- c(rep(60, each = 1), rep(61, each = 2), rep(62, each = 3), rep(63, each = 5), rep(64, each = 8),
rep(66, each = 8), rep(67, each = 10), rep(69, each = 13), rep(70, 10))

hist(x, breaks = 10)
skewness(x)
kurtosis(x)

