This post will run in three parts. Here, we take a Bayesian inference challenge and analyse it analytically and numerically. I have followed the book “Bayesian Statistics for Beginners” by Donovan and Mickey for reference.
Bayesian Inference
The objective of Bayesian inference is to update the probability of a hypothesis by incorporating new data. The generic form of the Bayes’ theorem is written as:
![]()
The left-hand side of the equation represents the posterior distribution of a single parameter, theta, given the observed data. The first term on the numerator is called the likelihood, and the second term is the prior distribution (the existing knowledge before the arrival of the new data) of the parameter. We will soon see what I meant by parameter and how the (distribution) functions for the likelihood and prior are selected. Remember, the integral in the denominator is a constant; we will use that information soon.
Sharks and Poisson
Now the problem you want to solve: it is known that, on an average year, five shark attacks happen in a particular place. Last year it rose to ten. Do you think it is abnormal, and how do you update your database based on this data?
Shak attacks are rare. And they follow no pattern; in other words, one episode is independent of the previous one. Yes, you are guessing it right; I want to use the Poisson distribution to describe the likelihood of shark attacks. Although the word “poisson” means fish in French, the distribution got its name after the famous French mathematician Simeon Poisson!
The Parameter
In our case, based on the historical data, five attacks occur a year. Now, can the average five justify seeing ten last year? You either use the formula as seen in an earlier post or the R code, dpoise(10, 5). The answer is ca. 0.018. What about using a parameter value of 6 or 8? If you plug in those numbers, you will find they also lead to non zero probabilities. In other words, it is better to use a set of numbers (also called a distribution) instead of a single number as your prior. A gamma distribution can provide that set for two reasons, 1) it can give a continuous range of parameter values you wanted 2) the function is well suited with Poisson for solving the integral of the Bayes’ equation analytically. If you want to know what I meant, check this out.
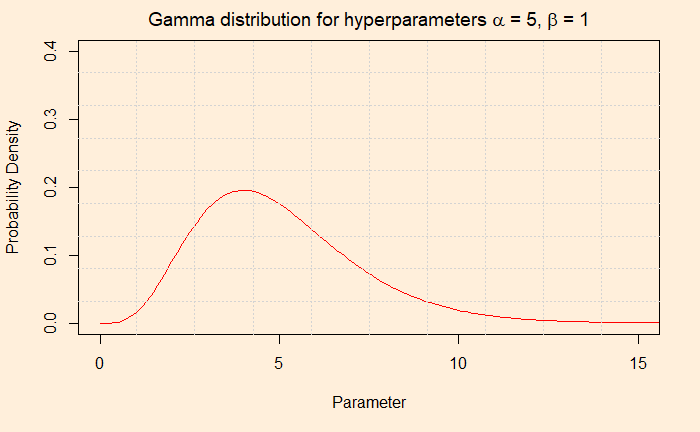
The Gamma distribution function has two hyperparameters, alpha and beta. We use the word hyperparameters to distinguish from the other (theta), which is the unknown parameter of interest. Alpha/beta gives the mean. In our case, we settle for alpha = 5 and beta = 1 for the prior. The average (5/1 = 5) is matching with the existing data. You may as well consider 10 and 2, which also gives a mean of 5, but we stick to 5 and 1. Before we go and do the analysis, which is in the next post, check the parameter values that we will input to the Poisson to use.

Yearly Worldwide Shark Attack Summary

