In the final episode of accident data analysis, we will go into the remaining key stats – injuries and fatalities – and postulate a potential problem with the interpretation, i.e. data registration. But first, a plot of the number of injuries per population.
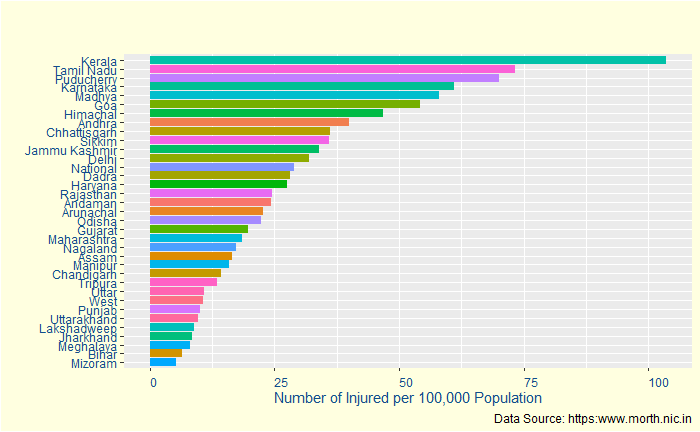
Kerala is now 33% more than the nearest rival, almost suggesting it is the most dangerous state for a passenger. But is that entirely true? Let’s see the following statistic – the fatalities per 100,000 population.
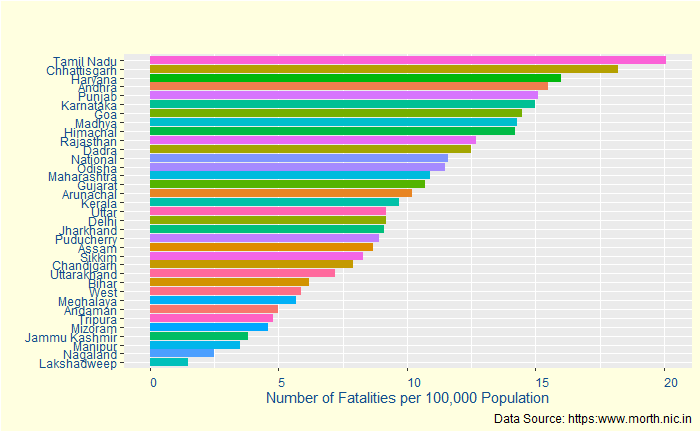
Strangely, it moves down to the 16th. Puducherry, which is third in injuries, also goes down. To understand this better, let’s define survival rate = the number of injured / (number of injured + number of dead).
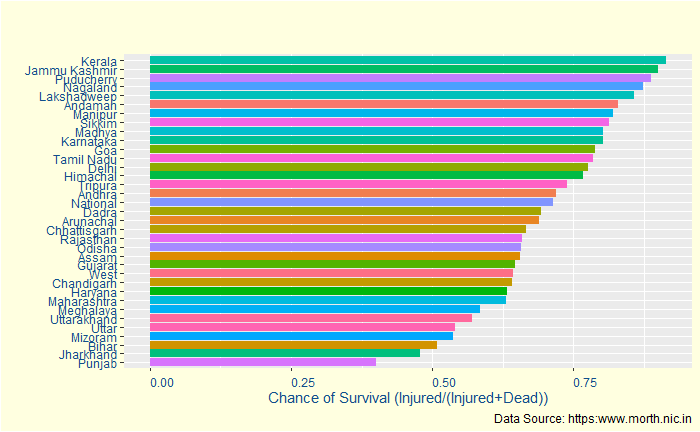
Yes, Kerala has a > 90% survival chance after an accident. It may indicate a few things:
1) Kerala has better accident care for the injured (that prevents them from dying)
2) Kerala has more proportion of low-intensity accidents compared to other states
3) Kerala’s registration system is more thorough in recording incidents. And higher survival rate is an artefact of having a higher reporting rate of all incidents, however minor it could be.
Not so fast
When you are about to conclude data collection, here is another one: the proportion of grievously injured people among the total Injured.
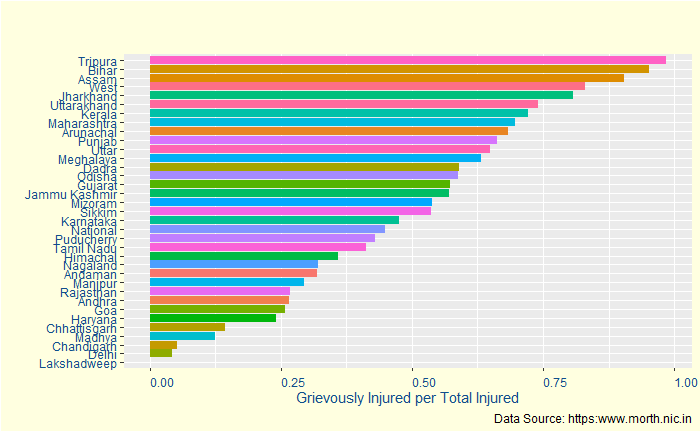
Almost 75% of the injured are seriously injured. So to conclude, Kerala remains one the most dangerous for road safety, but most of the injured are somehow saved, despite the severity.

