One of the rather unfortunate aspects of statistics is that it doesn’t say why something has happened. They also can’t reveal data quality, making it difficult to compare different entities. Therefore, it leaves the burden of interpretation in the hands of the (responsible) reporter. Not always a desirable combination! With this introduction, let’s continue with the road safety data. This time we go deeper into state-level statistics.
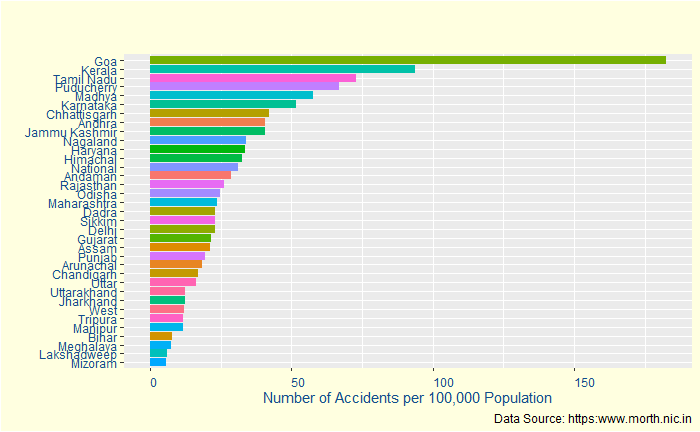
Number of Accidents

Does this make Goa the most accident-prone region? Not necessarily. It is one of the smaller states in India with about 1.4 mln population. The same goes for Puducherry, at number four, with a quarter of a million. If you want to know the difficulties of interpreting data from a smaller population, read this post. Another factor is the incident reporting system. It may not be a coincidence that the top four regions are also known for better data recording, with the three among the four (Kerala, Goa and Puducherry) at the top-5 of the human development index. We’ll come back to this a bit later.
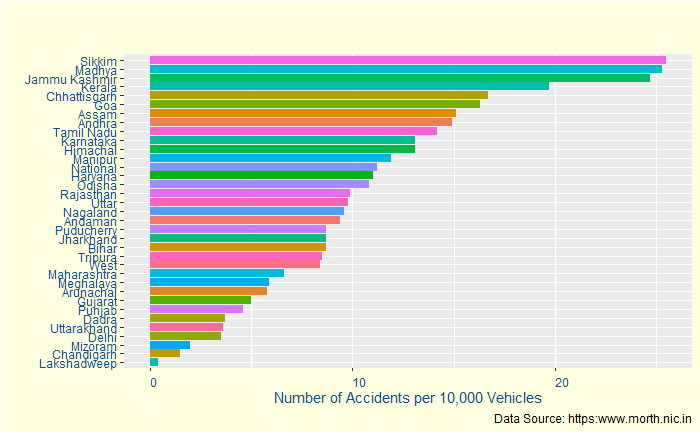
The same statistics on a different basis – the number of accidents per 10,000 vehicles – are below:

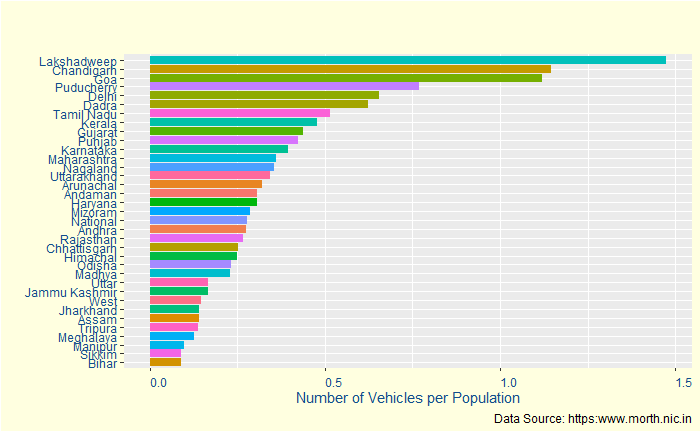
Before we move on: let’s try and understand if we can explain the top candidates based on their vehicle per population density. For that, we divide accidents per 100,000 population with accidents per 10,000 vehicles and divide by 10.

Yes, the top regions (Sikkim, Madhya Pradesh and Jammu & Kashmir) of the previous plot are way down in this plot. Again the statistics of smaller samples. That leaves one curious entity that we haven’t addressed so far – Kerala, which is among the top so far, not so small in population (33 million) or in vehicle density (~ 0.5). More about this coming up next.
The R code used for building the plots is below:
state_data %>%
  ggplot(aes(x=reorder(State, Acci_per_Pop), y=Acci_per_Pop, fill = State)) +
  geom_bar(stat = "identity") +
  geom_col() +
  coord_flip()
HDI of Indian States: Wiki

