We will use utility curves to illustrate three different kinds of risk preferences. They are:
Risk-averse

Here is a person who has the diminishing utility of marginal wealth. I.e., the extra dollar additional income from 10,000 to 10,001 brings a lesser increase in happiness to her than going from 100 to 101.
Notice the probabilistic (expected) utility line (blue) is below the certainty (brown).
Risk neutral
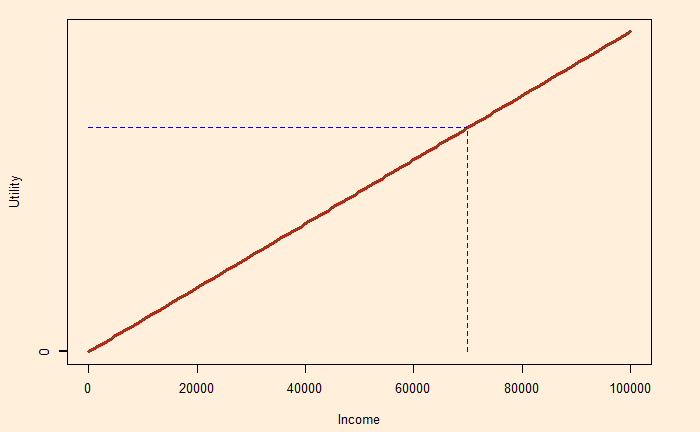
This person shows constant marginal utility. The person has the same happiness with a 1 dollar salary rise whether her current is at 10,000 or 100,000.
Risk lover
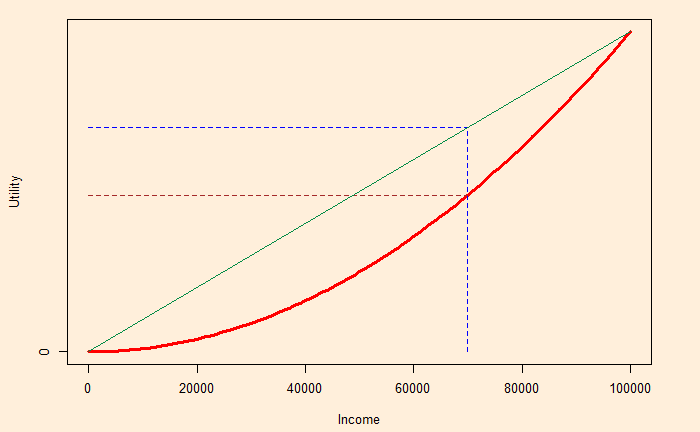
Imagine someone needs 100,000 for a major surgery to save her life. Smaller numbers don’t make much sense to her, and she is willing to gamble for a larger prize. She has increasing marginal utility.
Unsurprisingly, the expected utility line (blue) is above the certainty (brown).

