We have seen how risk-averse and risk-taking behave differently given options to take a certain $70,000 or a gamble with a 70% chance of winning $100,000. The former will take $70,000, and the latter will try the luck of winning $100,000. Remember, the expected value of both choices remains the same – $70,000. We have also seen that the utility of that money increases as the square root of the income (decreasing utility rate).
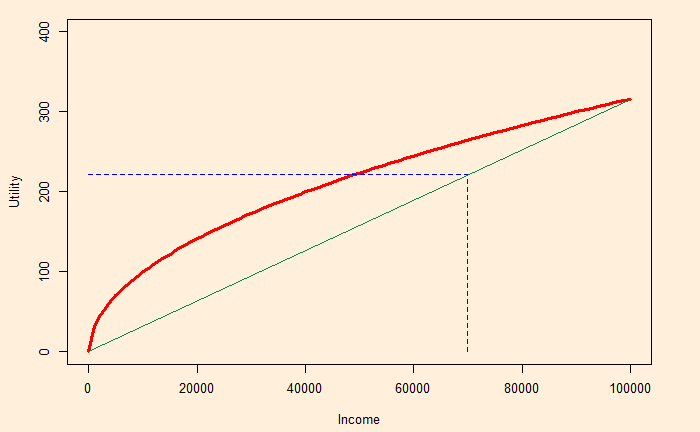
Also, using this example, we will work out the value of guarantees (insurance) for the risk-averse. The utility of the expected value is graphically represented as:

The vertical line touches the X-axis at 0.7 x 100,000 = 70,000, and the expected utility (not the guaranteed) is where the horizontal line touches the Y-axis. We have estimated this value in the previous post as 221.36.
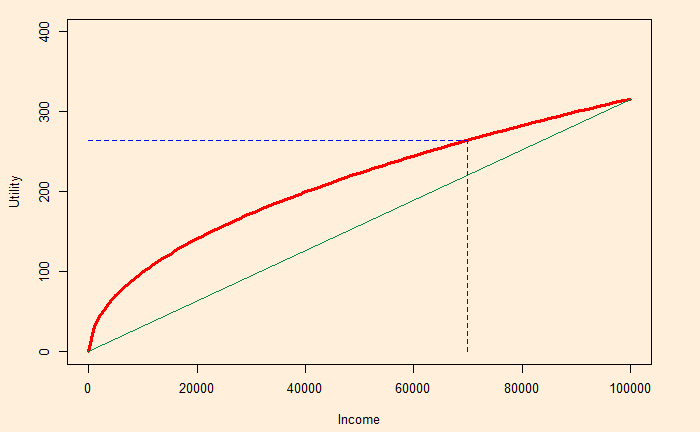
When the income is guaranteed (at 70,000), the corresponding utility becomes:

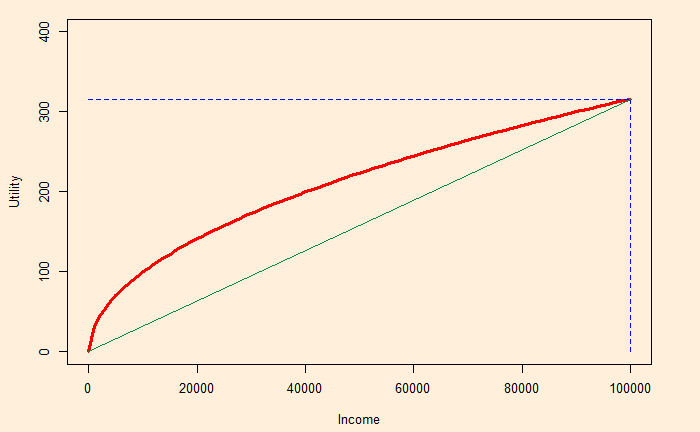
This guaranteed utility is 264.58, which the risk-averse is perfectly happy to accept. Note that the risk-lover is aiming for the full utility. (Although, in the process, she might end up with nothing!)

Insurance
The insurer can guarantee $70,000 at a fee. It is because, whereas it may have to give the individual $70,000, the insurance company knows that if several people gamble, at the end of the day, they will get $70,000. In other words, the expected value exists for the entity that oversees hundreds of gambles and not for the individual who only sees 0 or 100,000. And the fees become the profit for the company.
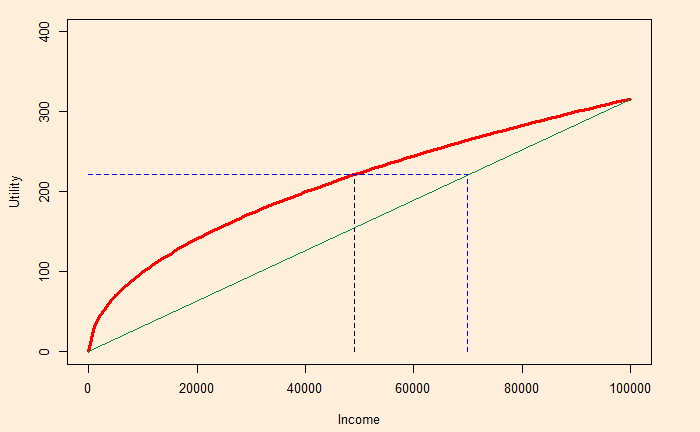
Look at how much income the gamble is worth (with certainty). It is the point at which the black dotted line hits the X-axis in the representation below:

It is about 49,000 in our example. The insurer absorbs it and promises 70,000. The individual and insurer may split the difference (70,000 – 49,000 = 21,000). Say, in one case, the insurer charges 5,000 as the fee, leaving the person with 65,000, equivalent to a utility of $253.

