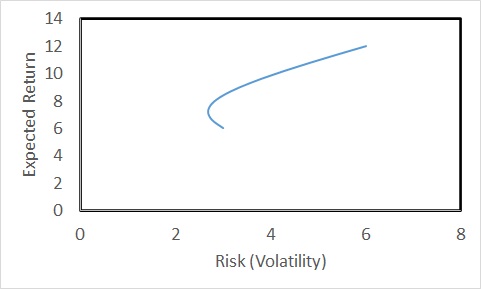
We have seen how simple portfolio theory explains the relationship between risk and returns. For example, the representation below.
This leads to the development of what is known as the Capital Market Line (CML). CML is a concept that combines the risk-free asset and the market portfolio. It is the line connecting the risk-free return and tangent to the ‘efficient frontier’ of the portfolio.
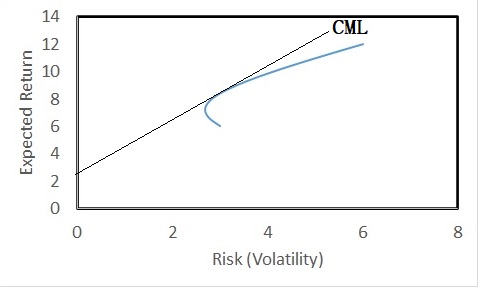
The slope of the Capital Market Line (CML) is the Sharpe Ratio of the portfolio.
Sharpe Ratio = (Return of the portfolio – risk-free rate) / Standard deviation
But there is something wrong with this line – or at least how people perceive the line of risk vs return. That is, next.

