We have seen linear and non-linear regressions in the past. One type of non-linear function is exponential. A familiar example is the decay of a signal with time.
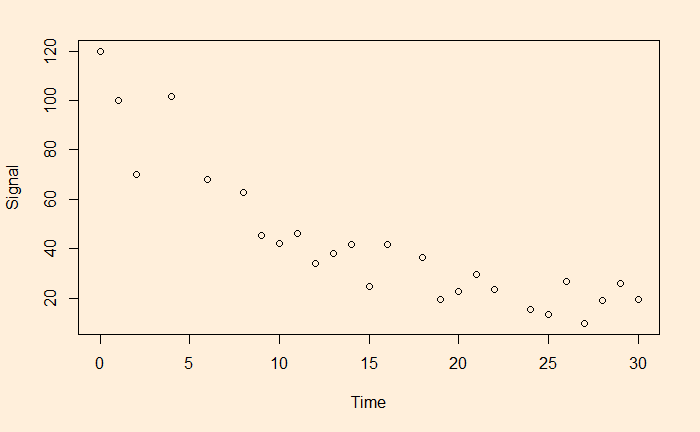
The easy way to perform the curve-fitting is to convert the exponential function to linear and perform an ordinary least square (OLS).

This is a linear function with slope = b and intercept = ln(a).
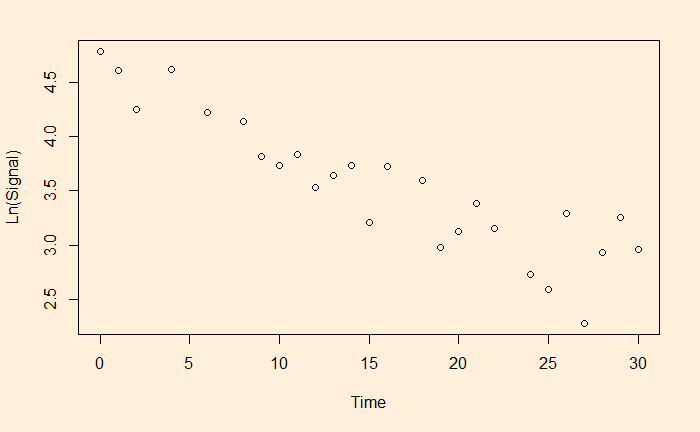
Let’s run a regression with these transformed variables.
df$ln <- log(df$Signal)
fit <- lm(ln ~ Time, data=df)
summary(fit)
Gives the output as
Call:
lm(formula = ln ~ Time, data = df)

Residuals:
     Min       1Q   Median       3Q      Max
-0.55119 -0.17134  0.03271  0.19116  0.54713

Coefficients:
             Estimate Std. Error t value Pr(>|t|)
(Intercept)  4.540757   0.110923   40.94  < 2e-16 ***
Time        -0.063229   0.006115  -10.34 2.55e-10 ***
---
Signif. codes:  0 ‘***’ 0.001 ‘**’ 0.01 ‘*’ 0.05 ‘.’ 0.1 ‘ ’ 1

Residual standard error: 0.2795 on 24 degrees of freedom
Multiple R-squared:  0.8167,	Adjusted R-squared:  0.809
F-statistic: 106.9 on 1 and 24 DF,  p-value: 2.552e-10
a = e4.540757 and b = -0.063229 and here is the plot of data along with the fitted curve.
xx <- seq(0,30)
plot(df$Time, df$Signal, xlim = c(0,30), ylim = c(0,130), xlab = "Time", ylab = "Signal")
lines(xx, exp(fit$coefficients[1])*exp(fit$coefficients[2]*xx), col = "red", lty = 2, lwd = 3)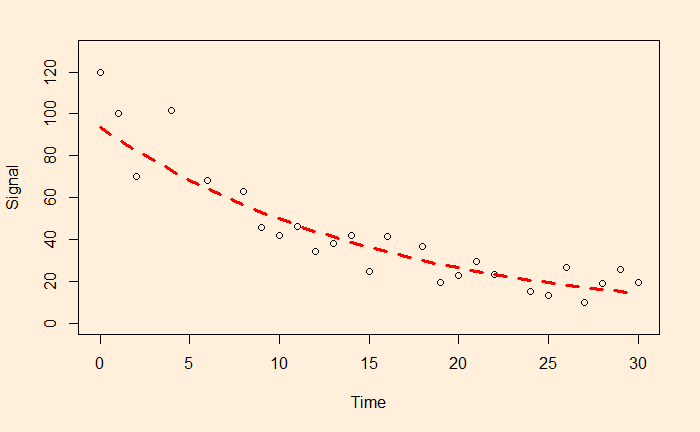
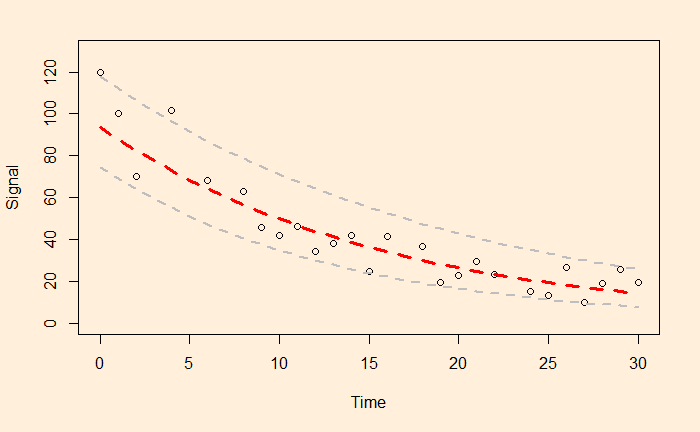
The next step is to get the confidence interval by running the confint() function.
conf_int <- confint(fit, level=0.95)
                  2.5 %      97.5 %
(Intercept)  4.31182187  4.76969119
Time        -0.07585068 -0.05060753
Incorporate them into the plot, and you get
xx <- seq(0,30)
plot(df$Time, df$Signal, xlim = c(0,30), ylim = c(0,130), xlab = "Time", ylab = "Signal")
lines(xx, exp(fit$coefficients[1])*exp(fit$coefficients[2]*xx), col = "red", lty = 2, lwd = 3)
lines(xx, exp(conf_int[1])*exp(conf_int[2]*xx), col = "grey", lty = 2, lwd = 2)
lines(xx, exp(conf_int[3])*exp(conf_int[4]*xx), col = "grey", lty = 2, lwd = 2)