This post refreshes the probability vs likelihood concept and presents a few R functions from the tigerstats library. As usual, we begin with a coin-flipping exercise. What is the probability of obtaining 45 heads upon flipping 100 fair coins? A fair coin is one in which the chance of getting heads equals the chance of getting tails: 0.5.
Here is a graphical representation of the ask.
library(tigerstats)
bound <- c(45,45)
pbinomGC(bound,region="between",size=100,prob=0.5,graph=TRUE)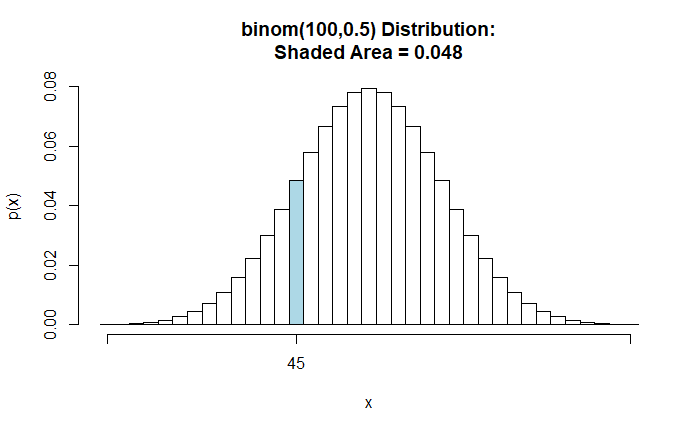
Coin tossing is a discrete event, and the Y-axis represents the probability. The probability of obtaining 45 heads while flipping 100 fair coins is 0.048.
Now, consider a continuous distribution. Suppose the heights of adults are normally distributed in a population with a mean of 175 cm and a standard deviation of 6.5 cm. What is the probability that a random person measures height between 185 and 190 cm?
sample <- c(185,190)
pnormGC(bound=sample,region="between", mean=175,sd=6.5,graph=TRUE)
Notice a few things: the Y-axis is not probability but probability density. The required probability is the area (under the curve) between two values, the height between 185 and 190 cm = 0.0515. In a continuous distribution, where the probability can take every possible value between 0 and 1, getting the chance for precise height (say, 180.0000) does not make sense.
Likelihood
If probability was about getting 45 heads for a coin with p = 0.5 tossed 100 times, the likelihood is the mirror image of that. What is the likelihood of having a fair coin (p = 0.5) if the coin lands 45 heads in 100 tosses?
In likelihood discussions, you have the data, i.e., 45 heads in 100 tosses. The investigator’s task is to find out the coin bias.
The likelihood that it’s an unbiased coin (p = 0.5), given that 45 in 100 landed on heads, is 0.048.
The likelihood that the coin is biased with p = 0.55, given that 45 in 100 landed on heads, is 0.011.
The likelihood that the coin is biased p = 0.4, given that 45 in 100 landed on heads, is 0.048.

Similarly, for heights,
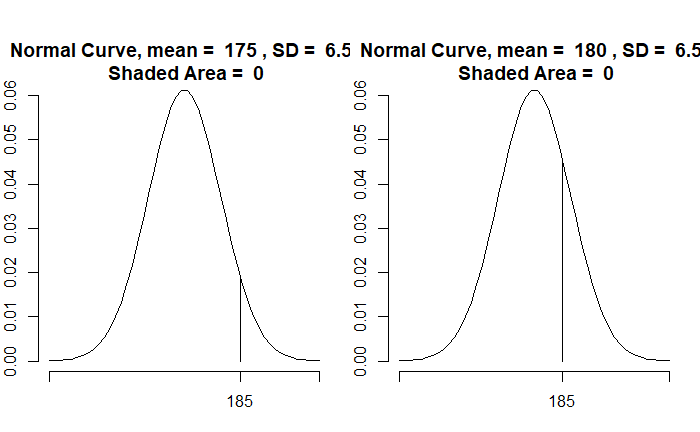
The likelihood of a distribution with mean = 175 cm and a standard deviation = 6.5 cm, given the measured height = 185, is 0.019
The likelihood of a distribution with mean = 180 cm and a standard deviation = 6.5 cm, given the measured height = 185, is 0.046
In summary
Probability is about the chance of data under a given distribution, P(Data|Distribution)
Likelihood is about the distribution for the given data, L(Distribution|Data)
Reference
Probability is not Likelihood. Find out why!!!: StatQuest with Josh Starmer

