So, the NBA postseason 2023 starts in a couple of days. Let’s look at how the teams performed in the regular season.
n_data <- read.csv("./nba23.csv")Most and least win
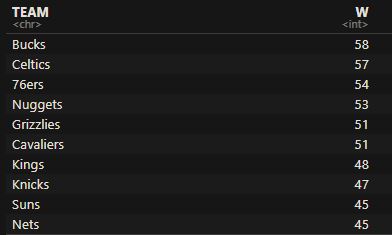
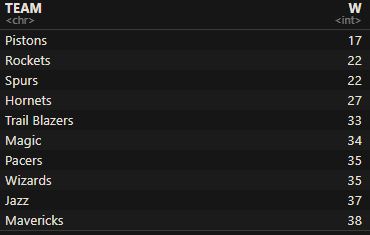
win_data <- n_data[order(-n_data$W),c(1,3)]
as_tibble(win_data)
Here are the top 10 and bottom ten
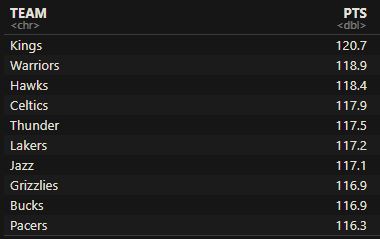
Most and least points per game
win_data_top <- n_data[order(-n_data$PTS),c(1,7)]
as_tibble(win_data_top)
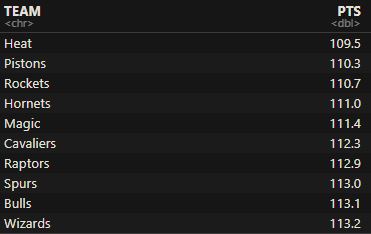
win_data_bot <- n_data[order(n_data$PTS),c(1,7)]
as_tibble(win_data_bot)