The purpose of sampling is to determine the behaviour of the population. For the definitions of terms, sample and population, see an earlier post. In a nutshell, population is everything, and a sample is a selected subset.
Population distribution
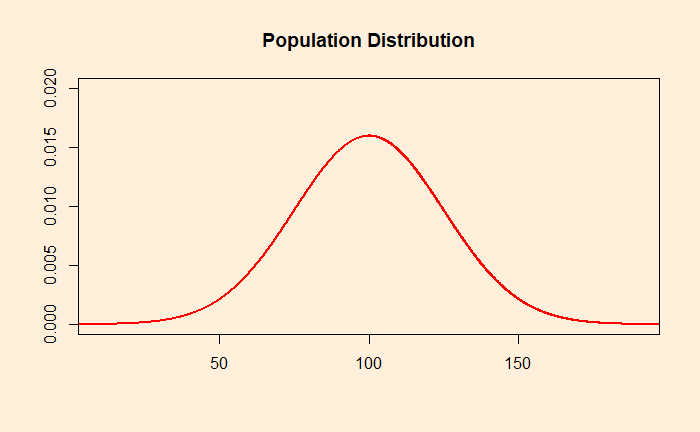
It is a frequency distribution of a feature in the entire population. Imagine a feature (height, weight, rainfall, etc.) of a population with a mean of 100 and a standard deviation of 25; the distribution may look like the following. It is estimated by measuring every individual in the population.

It means many individuals have the feature closer to 100 units and fewer have it at 90 (and 110). Still fewer have 80 (and 120), and very few exceptionals may even have 50 (and 150), etc. Finally, the shape of the curve may not be a perfect bell curve like the above.
Sampling distribution
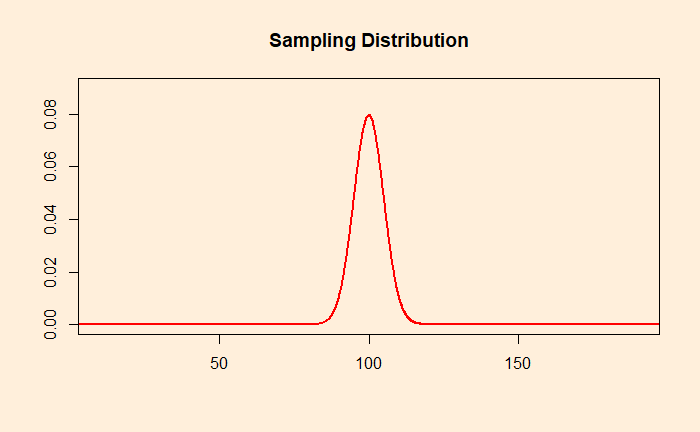
Here, we take a random sample of size n = 25. Measure the feature of those 25 samples and calculate the mean. It is unlikely to be exactly 100, but something higher or lower. Now, repeat the process for another 25 random samples and compute the mean. Make several such means and plot the histogram. This is the sampling distribution. If the number of means is large enough, the distribution will take a bell curve shape, thanks to the central limit theorem.
In the case of the sampling distribution, the mean is equal to the mean of the original population distribution from which the samples were taken. However, the sampling distribution has a smaller spread. This is because the averages have lower variations than the individual observations.
standard deviation of sampling distribution = standard deviation of population distribution/sqrt(n). The quantity is also called the standard error.


