I want to end the football penalty series with this one. We start with a finer data resolution and evaluate the statistical significance zone-wise. The insights from such objective analyses can tell you about statistical significance and how we can get misled easily.
Aiming high doesn’t solve
We have seen in the last post that the three chosen areas of the goal post – the top, middle and bottom – were not statistically differentiable. The following column summarises the results. Focus on whether or not the average success rate (0.69) falls within the confidence interval (for 90%) provided for each. Seeing the average inside the bracket means the observation is not significantly different.
| Area | Success (total) | p-value | 90% Confidence Interval | 0.69 IN/OUT |
| Top | 46 (63) | 0.5889 | [0.63, 0.81] | IN |
| Middle | 63 (87) | 0.6082 | [0.64, 0.80] | IN |
| Bottom | 86 (129) | 0.4245 | [0.60, 0.73] | IN |
| Overall | 195 (279) |
As you can see, none of the observations is out of the expected.
Zooming into zones
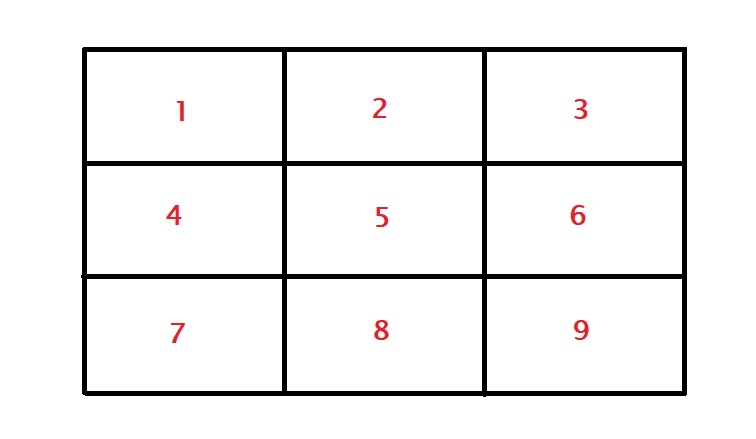
As the final exercise, we will check if a particular spot offers anything significant towards the goal. In case you forgot, here are the nine zones mapped between the goalpost. Note that these are from the viewpoint of the striker.

The data is in the following table.
| Zone | Total | Success | Success (%) |
| zone 1 | 28 | 21 | 0.75 |
| zone 2 | 19 | 11 | 0.58 |
| zone 3 | 16 | 14 | 0.88 |
| zone 4 | 36 | 27 | 0.75 |
| zone 5 | 18 | 11 | 0.61 |
| zone 6 | 33 | 25 | 0.76 |
| zone 7 | 63 | 40 | 0.64 |
| zone 8 | 20 | 12 | 0.6 |
| zone 9 | 46 | 34 | 0.74 |
A quick eyeballing may appear to tell you something about zone 3 (top right for the striker or top left of the goalkeeper) or zone 2. Let’s run hypothesis testing on each, starting from zone 1.
prop.test(x = 21, n = 28, p = 0.6989247, correct = FALSE, conf.level = 0.9)| Zone | 90% Confidence Interval | p-value |
| zone 1 | [0.60, 0.86] | 0.56 |
| zone 2 | [0.40, 0.74] | 0.25 |
| zone 3 | [0.68, 0.96] | 0.13 |
| zone 4 | [0.62, 0.85] | 0.70 |
| zone 5 | [0.42, 0.77] | 0.42 |
| zone 6 | [0.62, 0.86] | 0.46 |
| zone 7 | [0.53, 0.73] | 0.27 |
| zone 8 | [0.42, 0.76] | 0.34 |
| zone 9 | [0.62, 0.83] | 0.55 |
Fooled by smaller samples
Particularly baffling is the result on the zone there, where 14 out of 16 have gone inside, yet not significant enough to be outstanding. It shows the importance of the number of data points available. Let me illustrate this by comparing the same proportion of goals but with double the number of samples (28 from 32).
prop.test(x = 14, n = 16, p = 0.6989247, correct = FALSE, conf.level = 0.90)

prop.test(x = 14*2, n = 16*2, p = 0.6989247, correct = FALSE, conf.level = 0.90)
	1-sample proportions test without continuity correction

data:  14 out of 16, null probability 0.6989247
X-squared = 2.3573, df = 1, p-value = 0.1247
alternative hypothesis: true p is not equal to 0.6989247
90 percent confidence interval:
 0.6837869 0.9577341
sample estimates:
    p
0.875


	1-sample proportions test without continuity correction

data:  14 * 2 out of 16 * 2, null probability 0.6989247
X-squared = 4.7146, df = 1, p-value = 0.02991
alternative hypothesis: true p is not equal to 0.6989247
90 percent confidence interval:
 0.7489096 0.9426226
sample estimates:
    p
0.875
85% success rate for a total sample of 32 is significant. The outcome occurred as the chi-squared statistic grew from 2.3 to 4.7 when the sample sizes increased from 16 to 32. If you recall, the magic number for a 90% confidence interval (and degree of freedom of 1) is 2.7, above which the statistics become significant. It is also intuitive because you know that more data increases the certainty of outcomes (reduced noise). So collect more data and then conclude.
NOTE: chi-squared test may not be ideal for the 14/16 case due to smaller samples. In such cases, suggest running binomial tests (binom.test())

